FE 'tkGooie' Utilities

'SYSTEMtools' group

Meters for
Network Statistics

(drawn
Tachometer Style)

(FE = Freedom Environment)

GUI to show network
'interface' activity ---
using tachometer-style
meters --- drawn using
'create arc' and
'create oval' and
'create line' and
'create text' on 2
Tk 'canvas' widgets.

FE Home Page > FE Downloads Page >

FE 'tkGooies' Description Page >

FE 'tkGooies' 'SYSTEMtools' Menu >

This
'Meters_forNetStats_drawnTachStyle'
tkGooie code Page

INTRODUCTION to a Tcl-Tk script for a
'Meters for Network Statistics
(drawn Tachometer Style)' app

Around 2013 July, I put it on my 'to do' list to implement some practical applications for the nice 'tachometer style' meter for which Marco Maggi provided a demo script at wiki.tcl.tk/9107 back in 2003.

I have implemented one application of this meter --- to show memory and swap used on my computer at any time --- by using a Tk script as a 'wrapper' for the 'free' command, which is available on my operating system (Ubuntu 9.10, 2009 October, 'Karmic Koala').

The code for that pair-of-meters-application is on a page titled 'A Pair of Tachometer-style Meters --- for Memory and Swap'.

    (I plan to revisit that code to apply some techniques I learned from the code on this page.)

I had several other applications of the 'tachometer style' meter on my 'to-do' list --- including a network activity monitoring application.

That is the subject of this page.

Since the 'free' command (or a command returning similar data) is probably available on most Linux, Unix, and BSD systems --- and since the Apple Mac operating system is based on a BSD system, the 'memory-and-swap' utility is probably usable (with very little change) on Linux-Unix-BSD-Mac systems.

For this 'network activity' application, I decided to make a Tk wrapper script for the 'netstat' command, which returns data like


  $ netstat -i
  Kernel Interface table
  Iface   MTU Met   RX-OK RX-ERR RX-DRP RX-OVR    TX-OK TX-ERR TX-DRP TX-OVR Flg
  eth0       1500 0     23449      0      0 0         19670      0      0      0 BMRU
  lo        16436 0         4      0      0 0             4      0      0      0 LRU
  wlan0      1500 0         0      0      0 0             0      0      0      0 BMU
  wmaster0      0 0         0      0      0 0             0      0      0      0 RU


In particular, I want the Tk GUI to show two meters --- to show the rate of increase of the 'RX-OK' and the 'TX-OK' counts.

On Linux systems, there are many commands that show this network activity data.

For example, 'ifconfig' could be used as an alternative to 'netstat'.

See the following 'ifconfig' output.


  $ ifconfig -a -s
  Iface   MTU Met   RX-OK RX-ERR RX-DRP RX-OVR    TX-OK TX-ERR TX-DRP TX-OVR Flg
  eth0       1500 0     23449      0      0 0         19670      0      0      0 BMRU
  lo        16436 0         4      0      0 0             4      0      0      0 LRU
  wlan0      1500 0         0      0      0 0             0      0      0      0 BMU
  wmaster0      0 0         0      0      0 0             0      0      0      0 RU


And there are newer commands, like 'ip', that are said to be a replacement, eventually, for older commands like 'netstat'.

For now, I decided to go with 'netstat'.

Like with the 'free' command --- since the 'netstat' command (or a command returning similar data) is probably available on most Linux, Unix, and BSD systems --- and since the Apple Mac operating system is based on a BSD system, this 'network activity' utility is probably usable (with very little change) on Linux/ Unix / BSD / Mac systems.

---

Auto-Sampling rate

Besides showing two 'tachometer style' meters, side by side, on two Tk 'canvas' widgets --- I wanted to provide a 'scale' widget on the GUI, by which the user could specify, at any time, a new 'sampling rate' (actually, a 'wait-time' = 'wave-length', rather than a 'frequency').

I was able to implement that ability by use of the Tcl 'after' command, in the form

after   $WAITmillisecs   update_needles

This command is issued once to initialize the GUI --- and it is issued within the 'update_needles' proc itself, to continue sampling a network interface with the 'netstat' command.

    (I was concerned about this being a 'recursive' call of 'update_needles' to itself. But this did not turn out to be a problem.)

---

Manual intervention

I have also supplied a 'Refresh' button on the GUI, so that the user can request at ANY TIME, a new set of interface RX and TX values with which to update the GUI.

---

Method of drawing the meters

In putting together the code for this GUI, I drew heavily on the 'shadow-circle' technique of Marco Maggi to make nice looking meters.

And I included a 'red-line' (danger) area on the meters, like he did.

One rather unique thing about this implementation of the meters (something not done by Maggi in his demo) is that the window and the canvases and the meters are resizable.

In other words, I spent quite a bit of effort in converting Maggi's procs

  • FROM using hard-coded numbers for making the meters and their needles

  • TO using variables that work off of queries on the current size of frame and canvas widgets ('sub-windows').

So the user is able to resize the window and click on the 'Refresh' button to get a bigger version of the meters and the needle position.

After several iterations (including finding that I really needed to add an 'Ifaces' button on the GUI, to return to the user the network interfaces, on the user's computer, that are known to the 'netstat' command), I ended up with the GUI seen in the following image.

When the GUI first comes up, the two meters (their canvases) are sized at about 200x200 pixels --- and the data shown is based on an initial couple of executions of the 'netstat' command.

You can see the 'SYSTEMtools' tkGooies web page titled 'A Pair of Tachometer-style Meters --- for Memory and Swap' to see an example image that demonstrates that the user is able to resize the window and click on the 'Refresh' button to get a bigger version of the meters and the needle position.

---

Anti-aliasing (jaggies)

I had hoped to come up with a technique to avoid the 'aliasing' effect on the needles --- but I did not do it for the 'memory-and-swap' script --- and I have still not done that for this 'RX-and-TX-network-activity' script.

However, as 'retina display' monitors come into use more and more (with resolutions above about 2000x1500 pixels), even without changing the needle-drawing code in this script, you may find that the 'jaggies' are hard to see.

(I do not have such a monitor yet, so I cannot say for sure.)


CAPTURING THE GENERATED IMAGE:

When you get an image that you want to save --- say, to send an 'abuse report' to a web master at a site that has web pages that are blasting your interface card with unjustified traffic --- a screen/window capture utility (like 'gnome-screenshot' on Linux) can be used to capture the GUI image in a PNG or GIF file, say.

If necessary, an image editor (like 'mtpaint' on Linux) can be used to crop the window capture image.

The image could also be down-sized --- say to make a smaller image suitable for presentation in an email or on a web page.


A LITTLE NETWORK ACITIVITY EXPERIMENT:

Most of the time, my network interface card is experiencing no change to the cumulative counts of RX (received) and TX (transmitted) packets.

So the needles are usually resting at zero.

To perk up the meters, I opened my Seamonkey web browser and went to the YouTube site and started up a movie.

By doing that, I was able to capture the image above, that shows the needles off of their zero positions.

It was interesting to note, however, that the movie packets seem to be downloaded in bursts (buffers) --- because the needles would return to zero for periods of many seconds while a movie was running.


DESCRIPTION OF THE CODE

Below, I provide the Tk script code for this 'network activity in tachometers' display utility.

I follow my usual 'canonical' structure for Tk code for this Tk script:


  0) Set general window & widget parms (win-name, win-position,
     win-color-scheme, fonts, widget-geometry-parms, win-size-control,
     text-array-for-labels-etc).

  1a) Define ALL frames (and sub-frames, if any).
  1b) Pack   ALL frames and sub-frames.

  2) Define & pack all widgets in the frames, frame by frame.
              Within each frame, define ALL the widgets.
              Then pack the widgets.

  3) Define keyboard and mouse/touchpad/touch-sensitive-screen action
     BINDINGS, if needed.

  4) Define PROCS, if needed.

  5) Additional GUI initialization (typically with one or more of
     the procs), if needed.


This Tk coding structure is discussed in more detail on the page A Canonical Structure for Tk Code --- and variations.

This structure makes it easy for me to find code sections --- while generating and testing a Tk script, and when looking for code snippets to include in other scripts (code re-use).

I call your attention to step-zero.

One new thing that I have started doing recently is using a text-array variable --- named 'aRtext' --- for text in labels, buttons, and other widgets in the GUI.

This can make it easier for people to internationalize my scripts.

I will be using a text-array like this in most of my scripts in the future.


Experimenting with the GUI

As in all my scripts that use the 'pack' geometry manager (which is all of my 100-plus scripts, so far), I provide the four main 'pack' parameters:

  • '-side'
  • '-anchor'
  • '-fill'
  • '-expand'

on all of the 'pack' commands for the frames and widgets.

That helps me when I am initially testing the behavior of a GUI (the various widgets within it) as I resize the main window.

I think that I have used a pretty nice choice of the 'pack' parameters.

In particular ...

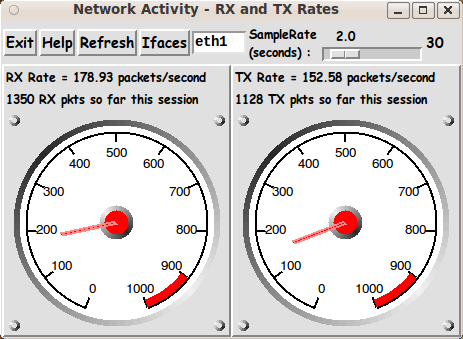
The label and button widgets stay fixed in size and relative-location if the window is re-sized --- while the two canvas areas (without scroll bars) expand/contract whenever the window is re-sized, and the 'Refresh' button is poked.

The meters expand/contract when the window is re-sized --- but probably not always in a way you would expect.

Occasionally, you may need to tug the borders of the window to center the meters in a way that suits you.

You can experiment with the '-side', '-anchor', '-fill', and '-expand' parameters on the 'pack' commands for the various frames and widgets --- to get the widget behavior that you want.

You can look into the code that is drawing the meters to see if you can devise meter-resizing behavior that pleases you more.

---

Additional experimentation with the GUI
--- its appearance:

You might want to change the fonts used for the various GUI widgets.

For example, you could change '-weight' from 'bold' to 'normal' --- or '-slant' from 'roman' to 'italic'.

Or change font families.

    In fact, you may NEED to change the font families, because the families I used may not be available on your computer --- and the default font that the 'wish' interpreter chooses may not be very pleasing.

I use variables to set geometry parameters of widgets --- parameters such as border-widths and padding.

And I have included the '-relief' parameter on the definitions of frames and widgets.

Feel free to experiment with those 'appearance' parameters as well.


Some features in the code

There are plenty of comments in the code to describe what most of the code-sections are doing.

You can look at the top of the PROCS section of the code to see a list of the procs used in this script, along with brief descriptions of how they are called and what they do.

The main procs are as follows.


   'make_tachometers' - to draw 2 meters within their 2 Tk (square) canvases.

                       (We allow the 2 canvases to resize according to
                        a resizing of the window. This proc will set the
                        SQUARE size of the 2 canvases according to the current
                        size of the frame containing the 2 canvases.)

   'make_one_tachometer' - called by 'make_tachometers', to make each meter.

   'draw_rivet'      - called by 'make_one_tachometer', 4 times, to put
                       rivets in 4 corners around a meter.

   'draw_circle_shadow'  - called by 'make_one_tachometer' to put a shadowed
                           edge around the circle that makes the meter.
                           Also called to help make a 'pin' in the center of
                           the meter to hold the needle. Also called to make
                           the 4 rivets.

   'update_needles'      - to update the needles on the 2 meters.

   'update_one_needle'   - called by 'update_needles', to draw each needle.

   'Refresh'             - called by 'Refresh' button. Runs 'make_tachometers'
                           and 'update_needles'.  

   'popup_msgVarWithScroll' - called by the 'Help' button,
                             to show text in variable $HELPtext.


Thanks to Marco Maggi whose 'shadow-circle' drawing technique (and code) made this script much easier to write.


Comments in the Code

It is my hope that the copious comments in the code will help Tcl-Tk coding 'newbies' get started in making GUI's like this.

Without the comments, potential young Tcler's might be tempted to return to their iPhones and iPads and iPods --- to watch videos of 'plump', shirtless guys talking to you while seated in front of their computers.


The Tcl-Tk CODE

Here is a link to CODE for the Tk script

'meters_net_stats.tk'.


The shell script (the 'wrapee') :

And here is the code for the shell script called by this Tk script.

You can put this script in the same directory with the Tk script.

The Tk script includes some code (involving the 'argv0' variable) to determine the location of the shell script by extracting the name of the directory in which the Tk script lies.

Here is a link to CODE for the SHELL script

'get_net_stats.sh'.


SIMILAR UTILITIES:

There are a couple of more 'meter utilities' on my 'to-do' list --- in the 'METERS' group of the FE 'tkGooies' system.

In particular, I may make a meter utility that shows CPU activity (preferably for all the CPU's on multiple-CPU computers, which are everywhere nowadays).


IN CONCLUSION

As I have said on other code-donation pages on this site ...

There's a lot to like about a utility that is 'free freedom' --- that is, no-cost and open-source so that you can modify/enhance/fix it without having to wait for someone else to do it for you (which may be never).

A BIG THANK YOU to Ousterhout for starting Tcl-Tk, and a BIG THANK YOU to the Tcl-Tk developers and maintainers who have kept the simply MAH-velous 'wish' interpreter going.

Bottom of this web page for
presenting Tcl-Tk code for
Meters for Network Statistics (drawn Tachometer Style)
--- a utility in the FE 'tkGooies' system,
in the 'SYSTEMtools' group.

To return to a previously visited web page location, click on the Back button of your web browser a sufficient number of times. OR, use the History-list option of your web browser.
OR ...

< Go to Top of Page, above. >

Page history:

The code was created in 2013 --- and posted 2013 Sep 06 at http://wiki.tcl.tk/38684.

This FE web page was created 2014 May 10.
(as a backup and alternative to the wiki.tcl.tk page)

This page was changed 2015 Oct 05.
(Small changes.)

Page was changed 2019 Mar 04.
(Added css and javascript to try to handle text-size for smartphones, esp. in portrait orientation.)

Page was changed 2019 Jul 04.
(Specified image widths in percents to size the images according to width of the browser window. Also added some web links.)


NOTE:
The code here MAY BECOME more 'up-to-date' than the code posted on the Tcler's Wiki ---
wiki.tcl-lang.org --- formerly wiki.tcl.tk.