FE 'tkGooie' Utilities

'3Dtools' group

a 3D Surface
Examiner for
Functions of 2 variables

(FE = Freedom Environment)

'tkGooie' GUI Interface for a
3D-surface examiner for
functions of two variables
---
the function of $x and $y
is entered in an 'entry'
field of the GUI
---
a listbox of sample
functions is provided

FE Home Page > FE Downloads Page >

FE 'tkGooies' Description Page >

FE 'tkGooies' '3Dtools' Page >

This 3D Examiner for Functions of 2 variables Page

INTRODUCTION to a
'3D Plot Examiner for functions of 2 variables'

I found the 3D model viewing programs at wiki.tcl.tk of 'MBS' (Mark Stucky) --- TITLE: '3dviewer : A canvas only viewer of 3D data' --- and 'GS' (Gerard Soohaket) --- TITLE: '3D polyhedra with simple tk canvas' --- quite inspiring

--- especially since I was surprised that one can rotate 2D projections of 3D models consisting of many hundreds of facets in 'real time' using 'plain vanilla' Tcl-Tk (no OpenGL required) --- using the 'create polygon' facility of the Tk canvas.

I have started to make some headway on similar viewers --- but with enhanced 3D model import options and some other enhancements.

However, before I get involved with a lot of 3D file format issues, I thought I would take on a slightly less ambitious project that would allow me to get some experience with rotating 3D model data.

In searches on wiki.tcl.tk for keywords like '3D', I ran across the page titled 'Viewer for functions of 2 variables' by AM (Arjen Markus), 2003 May.

I tried out his script and its performance indicated that it should be possible to use Tcl-Tk to do plots of 3D functions involving hundreds or even thousands of data points, projected onto a Tk canvas as polygons, within a second for each complete plot.

Below is an image of the demo plot from AM's 'view3d.tcl' script.

It is not apparent from this static image that 'AM' provided an 'animated' 3D plot.

'AM' animated the plot view with an oscillating view vector.

He used a 10 millisec pause at the end of each plot, before starting the rotation-projection calculations and 'create polygon' commands for the next plot.

One thing that IS apparent from the static image is that you can see that AM did not provide any widgets on this GUI for entering functions, specifying the rectangular grid on which the function is evaluated, controls for the rotation, etc. etc.

In fact, Arjen Markus (AM) wrote:

    "This is just another one of those little applications that may come in handy sometimes. Though it is not as flexible as it probably should be --- no facilities for entering the expression in a GUI, no adjustment of the scaling nor of the viewpoint --- still it can be a useful tool or the starting point of one."

MM (Marco Maggi) responded to AM's comment and provided another Tcl-Tk script, on that same page, that included facilities that AM mentioned. I ran MM's script on my Linux machine and captured the following image.

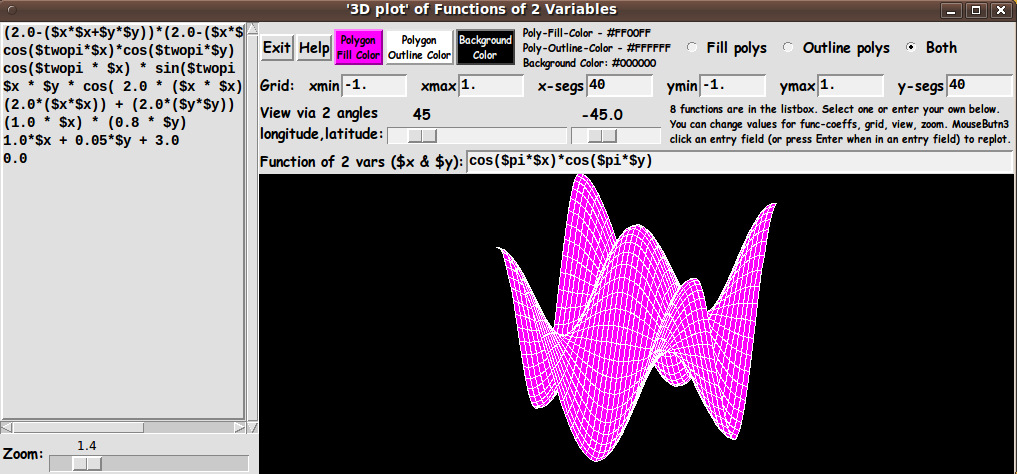
(I moved the entry field for the function f(x,y) to the top of the GUI, so that I could capture a smaller image with the entry field showing.)

You can see that MM provided about a dozen GUI widgets to make a Tk script that is quite a bit more useful, without the user having to edit the Tk script.

Some of the widgets he added :

  • MM provided a 'Draw' button to do the redraw after any changes via the widgets he provided.

  • MM added a function entry field and some control capabilities (mostly via spinboxes) --- such as adjustment of viewpoint (via longitude and latitude angles), xy domain setting (min,max), xy grid setting ('steps'), and some xyz scaling.

I found that keeping the function projection within the canvas (without distorting the plot) to be a rather slow, multi-step process with the MM script.

It seems the way to do that (and not distort the plot) is to change the x, y, and z scales equally, via 3 spinboxes and then click the 'Draw' button.

This is rather tedious and slow.

In fact, by providing the 'Draw' button as the ONLY way to redraw the plot after a change (esp. a viewpoint change), it is impossible to rotate the plot quickly and smoothly --- and thus investigate quickly whether the code is showing the surface correctly (esp. the hidden polygons) no matter the 'view point'.

Furthermore, color control in the AM and MM scripts was rather sparse.

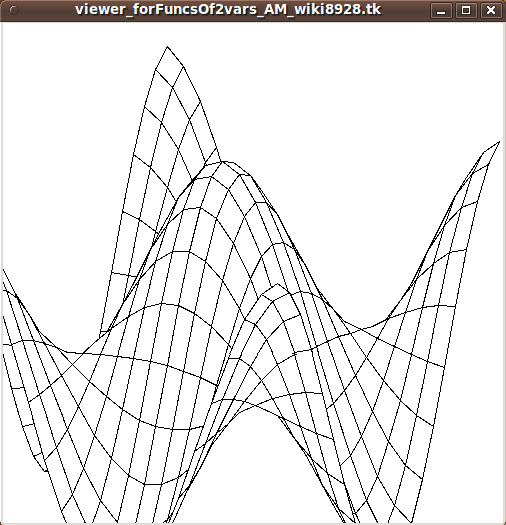
AM's function display was a wireframe --- black lines on a white background.

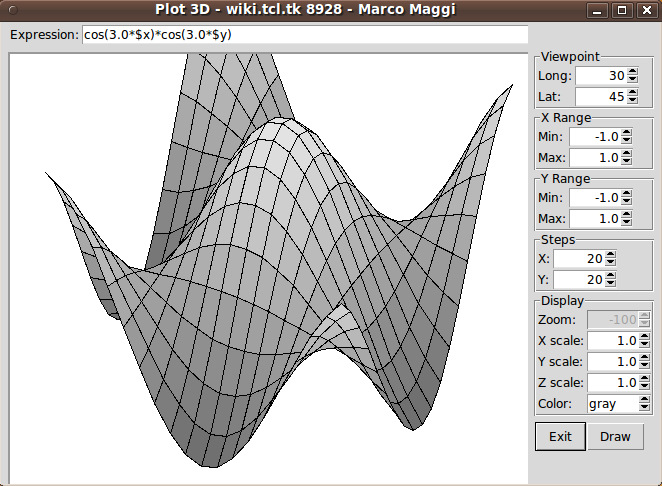
Although MM added some gray-shading of the polygons, there was no control of canvas background color and very little control of the color of the polygons.

MM provided 3 color options - gray, white, green - with shading provided in the gray case, based on z-height, NOT light source and angle of polygons to the light source.

Also, MM did not provide an option to turn off the wireframe (polygon outlines).


THE MATH:

The biggest problem that I had with the AM and MM scripts is that they did not document some of the critical mathematical expressions that they were using.

After a significant amount of web searching and book searching, I could not find similar formulas to ones used by AM & MM --- for example, for translation, rotation, and 2D projection.

In fact, after much web searching and book searching, I couldn't find ANY decent COMPLETE presentation of formulas for projecting 3D points in xyz-space onto a viewing plane determined from a given view direction (given by longitude and latitude angles) --- especially a presentation that applied fairly directly to this application --- plotting of a function f(x,y) or a surface of that type.

There are, of course, general presentations of rotation matrices in various books on 3D CG (computer graphics), but I could not find a presentation that applied a general presentation to a more specific case like rotating and projecting a 3D-plot of a function of 2 variables.

Most presentations in CG books gave an extremely cursory treatment of going from a 3D rotation to a 2D projection, if any presentation at all.

Rather than trying to use the AM or MM formulas and their approach (that were hard for me to 'crack'), I decided to derive an approach and set of formulas myself.

If I could do so, then I would understand the formulas and their application methods and limits much better.


MY GOALS:

I decided to make a similar utility to the AM-MM 3D plot utility --- but with more complete documentation of the methods used --- and with a few added 'bells and whistles'.

Below are listed some features of my script versus the MM script.

1) ROTATION METHOD:

MM allowed the user to specify latitude and longitude angles to specify the view direction. I do the same.

However, instead of spin-boxes, I use Tk scales so that setting the 2 view angles can be done more quickly and redraw is more immediate.

I use 'button1-release bindings' on the 'scale' widgets to cause the redraw as soon as a scale change is complete.

    (I may eventually add bindings to mouse events on the canvas, like <Motion>, so that the view rotation can be done even more quickly and conveniently.

    This would be similar to rotate/zoom/pan controls that Mark Stucky provided in a 3D model viewer that he published at wiki.tcl.tk/15032.)

2) FUNCTION ENTRY:

In addition to having an entry field for the function f(x,y), I added a 'listbox of sample functions' on the left of the GUI.

Clicking on a line in the listbox puts a function in the entry field.

This provides a way of providing some interesting functions that a user can quickly try (and alter), instead of the user spending time trying to think of functions to try.

By using the listbox with scrollbars, an essentially unlimited number of interesting functions could be supplied eventually.

3) COLOR CHOICES:

I allow color choices for the

  • polygon fill color
  • polygon outline color
  • canvas background color

from among 16 million colors, each.

4) DISPLAY OPTIONS:

I provide 3 radiobuttons by which polygon fill, outline (wireframe display on the canvas background color), or both (fill and outline) can be specified.

5) ZOOM OPTION:

I provide a 'zoom' Tk scale widget, by which the plot can easily be resized, down or up --- to make sure the entire plot can be seen on the canvas.

Like with the 2 scales for the longitude-latitude view angles, I use a button1-release binding on the zoom scale to cause the redraw as soon as a scale change is complete.

6) MATH APPROACH:

I have derived a set of formulas based on a Ry * Rz rotation matrix approach where Rz is a (longitudinal or 'yaw') rotation about the 'global' z-axis that is applied to each 3D point (x,y,z=f(x,y)) --- and then Ry is a (latitudinal or 'pitch') rotation about the 'global' y-axis --- where z is up, y is to the right, and x is out of the screen.

    (No 'roll' around the x axis ... too disorienting.

    'Roll' is for fighter jet simulations and for emulating a modern cork-screw, turn-me-upside-down roller coaster ride.)

I may publish a discussion of the mathematical details, complete with illustrative diagrams, on another web page --- since such discussions seem so hard to find.

    (I challenge anyone to find a discussion that applies directly and completely to this application --- and that takes you right up to the point of providing pseudo-code.)

The derivation/walk-thru has been instructive to me.

The concepts and techniques will probably be useful for other 3D Tk-script projects --- such as viewing of terrain surfaces and examining 3D models (composed of triangular polygons).


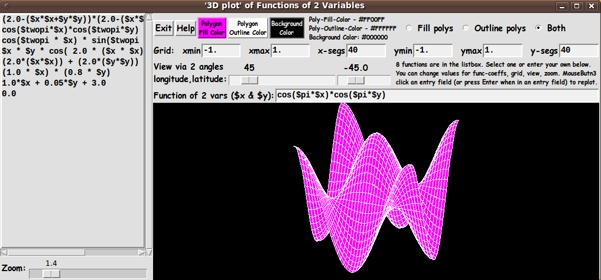
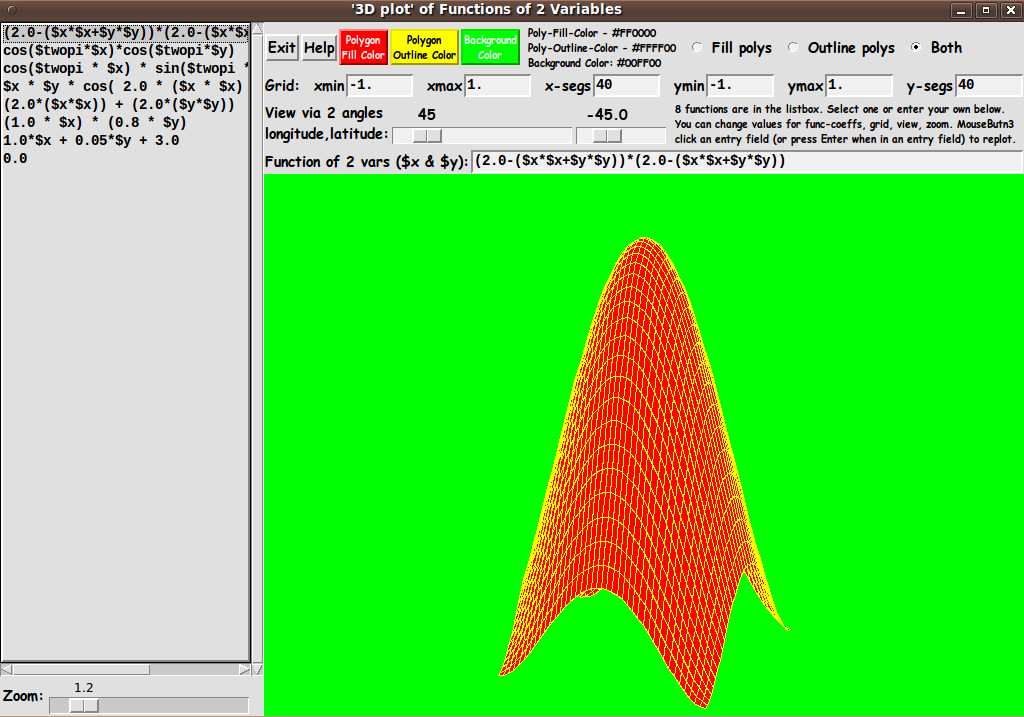
SCREENSHOT of the GUI:

In aiming to accomplish these goals, I ended up with the GUI seen in the following image.

In this image, you can see the three buttons for color-setting, across the top of the GUI --- 'Fill', 'Outline', and 'Background'.

To the right of the color-setting buttons, you can see the fill/outline/both radiobuttons, which are used to basically allow for switching between a 'wireframe' display and an opaque-color display.

The next frame down contains the 'Grid' entry fields --- for xmin, xmax, x-segs, ymin, ymax, and y-segs.

And the next frame contains the 2 scales for the longitude and latitude rotation angles.

And below that frame is the entry field for the function f(x,y).

The 'Help' button shows the following text.

The help text describes the various ways in which a 'draw' is triggered.


OPERATION HELP for this
3D f(x,y) Function Plotting Utility

SELECTING/ENTERING A FUNCTION:

When the GUI comes up, you can use the listbox to select a function, f(x,y), to plot.

Use MouseButton1 (MB1) click-release to put a function in the function entry field.

The function will be immediately plotted in the canvas area.

Alternatively, you may enter a function of your own choosing in the 'function-entry-field'.

The main rule to observe is to use '$x' and '$y' to represent x and y.

And, of course, you should compose a syntactically-correct math expression that is to be evaluated at each x,y location on a rectangular grid of x,y coordinates.

CHANGING A FUNCTION:

You can change coefficients in a function or the formulation of the function, in the entry field.

To re-plot the new function, you can press the Enter key --- or to re-plot at any time, you can MB3-click-release on the 'function-entry-field'.

ALTERING THE GRID:

You can change the grid parameters --- xmin,xmax,x-segs, ymin,ymax,y-segs --- by entering new values.

To re-plot based on the new grid, you can press the Enter key in any grid entry field --- or to re-plot at any time, you can MB3-click-release on any of the 'grid-entry-fields'.

CHANGING THE VIEW ANGLE:

You can use the two 'angle-scale' widgets to quickly change either of a couple of rotation angles --- longitude and latitude.

An MB1-release of the slider on an angle-scale widget causes a replot.

You can simply keep clicking in the 'trough' of either scale widget (to the left or right of the scale button) to step through a series of re-plots, varying an angle one degee per click-release.

ZOOMING:

You can use the 'zoom-scale' widget to magnify or shrink the plot.

An MB1-release of the slider on the zoom-scale widget causes a replot.

Click in the 'trough' --- on either side of the scale's button --- to zoom in/out a little at a time.

FILL/OUTLINE/BOTH:

The fill/outline/both radiobuttons allow for showing the plot with the polygons (quadrilaterals) color-filled or not --- and with outlines ('wireframe' mode) or not.

COLOR:

Three COLOR BUTTONS on the GUI allow for specifying a color for

  • the interior of the polygons
  • the outline of the polygons
  • the (canvas) background.

Summary of 'EVENTS' that cause a 'REDRAW' of the plot:

Pressing Enter/Return key when focus is in the 'function-entry-field'. Alternatively, a button3-release in the 'function-entry-field'.

Pressing Enter/Return key when focus is in the

  • 'xmin' entry field
  • 'xmax' entry field
  • 'x-segs' entry field
  • 'ymin' entry field
  • 'ymax' entry field
  • 'y-segs' entry field

Alternatively, a button3-release in any of the 'grid-entry-fields'.

Button1-release on the LONGITUDE or LATITUDE scale widget.

Button1-release on the ZOOM scale widget.

Button1-release on the FILL or OUTLINE or BOTH radiobuttons.

Changing color via the FILL or OUTLINE color buttons.

ALSO: Resizing the window changes the size of the canvas, which triggers a redraw of the plot according to the new canvas size.


Overview of the Code

I provide the code for this 3D-plot Tk-GUI script below.

I follow my usual 'canonical' structure for Tk code for this Tk script:


  0) Set general window & widget parms (win-name, win-position,
     win-color-scheme, fonts, widget-geometry-parms, win-size-control,
     text-array-for-labels-etc).

  1a) Define ALL frames (and sub-frames, if any).
  1b) Pack   ALL frames and sub-frames.

  2) Define & pack all widgets in the frames, frame by frame.
     Within each frame, define ALL the widgets. Then pack the widgets.

  3) Define keyboard and mouse/touchpad/touch-sensitive-screen action
     BINDINGS, if needed.

  4) Define PROCS, if needed.

  5) Additional GUI initialization (typically with one or more of
     the procs), if needed.


This structure is discussed in more detail on the page A Canonical Structure for Tk Code --- and variations.

This structure makes it easy for me to find code sections --- while generating and testing a Tk script, and when looking for code snippets to include in other scripts (code re-use).

I call your attention to step-zero. One new thing that I have started doing recently is using a text-array for text in labels, buttons, and other widgets in the GUI. This can make it easier for people to internationalize my scripts. I will be using a text-array like this in most of my scripts in the future.


Experimenting with the GUI

As in all my scripts that use the 'pack' geometry manager (which is all of my 100-plus scripts, so far), I provide the four main pack parameters --- '-side', '-anchor', '-fill', '-expand' --- on all of the 'pack' commands for the frames and widgets.

That helps me when I am initially testing the behavior of a GUI (the various widgets within it) as I resize the main window.

I think that I have used a nice choice of the 'pack' parameters. The labels and buttons and scales stay fixed in size and relative-location as the window is re-sized --- while the 'canvas' expands/contracts as the window is re-sized.

You can experiment with the '-side', '-anchor', '-fill', and '-expand' parameters on the 'pack' commands for the various frames and widgets --- to get the widget behavior that you want.

---

Additional experimentation:

You might want to change the fonts used for the various GUI widgets. For example, you could change '-weight' from 'bold' to 'normal' --- or '-slant' from 'roman' to 'italic'. Or change font families.

In fact, you may NEED to change the font families, because the families I used may not be available on your computer --- and the default font that the 'wish' interpreter chooses may not be very pleasing.

I use variables to set geometry parameters of widgets --- parameters such as border-widths and padding. And I have included the '-relief' parameter on the definitions of frames and widgets.

Feel free to experiment with those 'appearance' parameters as well.

---

Note that the color buttons call on an 'external' color-selector-GUI Tk script to set the colors.

You can make that color-selector script by cutting-and-pasting the code from the page A non-obfuscated color selector GUI on this site.


Some features of the code

There are plenty of comments spread throughout the code to describe what most of the code-sections are doing.

You can look at the top of the PROCS section of the code to see a list of the procs used in this script, along with brief descriptions of what they do and how they are called.

See comments in the procs for details on the purpose of each proc and for details on the methods by which each proc was implemented.

Below is a 'condensed' overview of the procs --- to give an idea of the 'guts' of this utility:


   - 'listboxSelectionTOentryString'  - called by a button1-release binding
                                        on the example-functions listbox

   The following 4 procs are called in several procs below -
   to perform movements of the model geometry and draw the polygons.

   - 'load_points_array'
   - 'translate_points_array'
   - 'rotate_points'
   - 'draw_2D_pixel_polys'

   -----------------------------

   - 'update_status_label'      - shows the draw-time (millsecs) in a label.
                                  Called by proc 'draw_2D_pixel_polys'.
   -----------------------------

   - 'load-translate-rotate-draw' - a proc that calls 4 procs:
                                      - load_points_array
                                      - translate_points_array
                                      - rotate_points
                                      - draw_2D_pixel_polys

                                    Called by Enter-key and MB3-button1-release
                                    bindings on the f(x,y) function entry field
                                    and on 6 entry fields for x & y min,max,segs.

    - 'rotate-draw'               - a proc that calls 2 procs:
                                      - rotate_points
                                      - draw_2D_pixel_polys

                                  Called by button1-release bindings
                                  on the latitude & longitude 'scale' widgets.

    - 'wrap_draw_2D_pixel_polys'  - a proc that calls 1 proc:
                                      - draw_2D_pixel_polys

                                  Called by button1-release bindings
                                  on the Zoom 'scale' widget and on the
                                  fill/outline/both radiobuttons.
                                  Also called by the 'set_*_color*' procs.

   -----------------------------

    - 'set_polygon_color1'    - called by the polygon-fill color button.

    - 'set_polygon_color2'    - called by the polygon-outline color button.

    - 'set_background_color'  - called by the background color button.

    - 'update_colors_label'   - called by the 3 'set_*_color*' procs

   -----------------------------

    - 'popup_msg_var_scroll'  - to show Help text (and perhaps other msgs)


One interesting feature of this GUI is the way the procs involved in a redraw are broken up into a sequence of four procs:

  1. load_points_array
  2. translate_points_array
  3. rotate_points
  4. draw_2D_pixel_polys

Some 'events' --- such as changing the function or the grid --- trigger the execution of all 4 procs (in that order), while other events (like longitude or latitude change) trigger the execution of only the last 2 procs.

And some 'simple' changes (like a color change or a switch to wireframe mode) trigger the execution of only the last proc.

Note that I do most of the calculations in 'world coordinates', NOT pixel coordinates.

All the calculations in the first 3 of the 4 procs are done in world coordinates.

It is in the 4th proc that I obtain a set of 2D points from a family of 3D points, and I map a 'bounding area' of the 2D points into the current canvas area, in units of pixels --- to finally get the plot, via 'create polygon' commands.

---

Like AM (Arjen Markus), I use the "painter's algorithm" (or my interpretation of it) to handle hiding portions of polygons that are hidden by polygons in the foreground.

Hence I start drawing polygons from the corner of the grid that is farthest away from our view point (eye).

In other words, I let an xy-plane quadrant --- over which the 'eye' lies --- (i.e. a quadrant determined by the longitudinal angle) determine the 'start corner' of the 'painting'.

For example, if the 'eye' is over the first quadrant of the xy plane, the 'start corner' of 'painting' will be the xmin,ymin (far) corner of the 'rectangular grid' below our x,y,f(x,y) points.

2nd example: If the 'eye' lies over the 3rd quadrant of the xy plane, the 'start corner' of 'painting' will be the xmax,ymax corner of the 'rectangular grid'.

Similarly, if over the 2nd quadrant, we start at xmax,ymin.

And, if over the 4th quadrant, we start at xmin,ymax.

If the 'eye' lies over the origin (or the x or y axis), then there are multiple choices for a 'start corner'.

---

It is my hope that the copious comments in the code will help Tcl-Tk coding 'newbies' get started in making GUI's like this.

Without the comments, potential young Tcler's might be tempted to return to their iPhones and iPads and iPods --- to watch videos of 101 ways to hurt yourself on a trampoline.


The Tcl-Tk SOURCE CODE

Here is a link to CODE for the Tk script
'3Dexaminer_forFunctionsOf2XYvars_ 3DprojectOn2Dcanvas_ RyRz.tk'.

With your web browser, you can 'right-click' on this link --- and in the menu that pops up, select an item like 'Save Link Target As ...' --- to save this file to your local computer.

Then you can rename the file to remove the '.txt' suffix. Make sure that you have execute permission set on the file --- in order to execute the script.


The image below is an example of the result of changing the default fill, outline, and canvas colors.

SOME POTENTIAL ENHANCEMENTS:

Eventually some other features may be added to this utility :

  • The ability to pan the plot, as well as rotate and zoom it.

  • The ability to use mouse motions on the canvas to rotate, zoom, and pan the plot.

    For example:
    MB1 to rotate, MB2 to zoom, and MB3 to pan the surface plot.

  • An option to vary the color of the filled polygons may be added --- say, by choosing polygon color according to the average of f(x,y) at the 4 corners of each quadrilateral --- i.e. according to a 'z height'.

    (DONE - see '2012dec18 UPDATE' image below.)

  • More polygon-color assignment options may be added --- so that the user can have colors added to polygon vertices or polygons --- to 'liven up' the surface plot.

    For example, options to assign random colors or rainbow colors to the points/facets may be added.

  • An option to shade the polygons may be added --- to change the color of the polygon faces according to the angle that they make with a light source.

      (Initially we may assume that the light source is coming from the viewer.

      But eventually we may add the ability to specify a different, arbitrary direction of the light source.)

  • More functions may be added to the listbox.

    (Many were added in a 2012dec28 update. See image below.)

  • Depth clipping may be added --- so that the user can essentially get section views of the surface.

  • Sorting and 'painting' according to 'z-depth' of the polygons could be added --- to allow for (perhaps?) better showing/hiding of near and far polygons.

  • More elaborate shading techniques may eventually be implemented --- to get smoother shading effects across polygon edges, and perhaps to get glossy effects.

      (These effects may be easiest to implement by using colors assigned to polygon vertex points rather than colors assigned to polygons.)

  • Add a 'triad' to show the orientation of the xyz axes in any (re)plot.

I may add a few more ideas for enhancements in coming months (or years), as I tackle other 3D utilities.


2012dec17 UPDATE

I added a display of milliseconds to do each redraw --- to help get an idea of whether the 'model' (data-surface or data-cloud) can be rotated smoothly via mouse motions on the canvas.

The milliseconds are displayed in the label widget to the right of the longitude-latitude scale widgets.

If we can do redraws in about 50 milliseconds (corresponding to a 'frame rate' of 20 frames per second), we should be able to rotate the data cloud rather smoothly.

It turns out that a 40x40 data grid was re-drawing at around 70 milliseconds (plus or minus about 10 milliseconds), on my computer.

Not surprisingly, an 80x80 data grid was taking about 3 to 4 times as long for a re-draw --- about 220 milliseconds.

If this script were changed to allow for 'immediate' rotation according to mouse motion on the canvas, then the rotation may be a bit 'jumpy' for large grids but may be pretty smooth for grids on the order of 30x30.

There may be some ways to change the calculations to get a significant speed up of the redraws and thus allow for smooth rotation of larger grids.

---

Besides the addition of the redraw-milliseconds display, this update included a few changes to the 'rotate' proc and changes to some scale parameters for the three scale widgets.

Some font inconsistencies and digits-displayed inconsistencies of a couple of the scales were fixed.

Also, '-repeatdelay 500' and '-repeatinterval 50' parameters are now present on all three scales.

If the responsiveness of the sliderbar movements is not to your liking, you can change these milliseconds values.

I replaced the code above with the new code.


2012dec18 UPDATE

When the user chooses the 'fill-only' (no outlines) radiobutton, the plot looks like a blob of solid color, when all the polygons are painted the same fill color.

So, like MM did with the gray color option of his 3D function viewer, I have added some code to the 'draw_2D_pixel_polys' proc to provide gradation of the fill color of polygons according to the average z-height of each polygon.

Below is an example plot.

This is a somewhat 'expensive' operation.

The draw times went up a factor of about 50% --- from about 65 millisecs to about 95 millisecs.

So this gradation of the user-selected fill-color is done only in the case that the user chooses 'fill-only' (no outlines).

    (Note:
    The color assignment according to z-height can be improved. This was just a first attempt.

    If it turns out that the 'format' command is eating up most of the time, I can probably get a big improvement by using an index into a table of about 20 colors, instead of using 'format'.

    Also, I can get some improvement during rotation of the model by computing the 4-vertex average-z-height of the polygons just one time for a given function and grid --- and storing the averages in an array for repeated use.

    I.e. gain some speed at the cost of some memory.

    I may return to this issue someday and provide a significantly faster z-height-color-assignment routine.)

I replaced the code above with the new code.


2012dec28 UPDATE

I added about 40 functions to the functions listbox --- including some functions that give sombrero-like surfaces.

Below is a sample sombrero image.

The image abvoe is done with 'fill-only' (no outlines).

In that case, the z-height-color-assignment routine was automatically invoked, as mentioned above, in order to get an image that was not just a blob of solid, unshaded color --- in this case, gray.

I replaced the code above with the new code.

Bottom of this page for a
3D Examiner for Functions of 2 X,Y variables
--- a utility in the FE 'tkGooies' system,
in the '3Dtools' group.

To return to a previously visited web page location, click on the Back button of your web browser a sufficient number of times. OR, use the History-list option of your web browser.
OR ...

< Go to Top of Page, above. >

Page history:

The code was originally posted at http://wiki.tcl.tk/37451 on 2012 Dec 15.

The code on the wiki was updated 2012 Dec 17, 18, and 28.

This FE web page was created 2014 May 04 --- as a backup and alternative to the wiki.tc.tk page (and site).

Page was changed 2016 Jan 02.
(Added some links and some paragraphs.)

Page was changed 2019 Feb 23.
(Added css and javascript to try to handle text-size for smartphones, esp. in portrait orientation.)

Page was changed 2019 Jun 12.
(Specified image widths in percents to size the images according to width of the browser window.)


NOTE:
The code here MAY become more 'up-to-date' than the code posted on the Tcler's Wiki --- wiki.tcl-lang.org --- formerly wiki.tcl.tk.