|
INTRODUCTION :
The following 'country outline files' were created from
KMZ
(or
GeoJSON)
files using a rather tedious process ---
such as the following for KMZ files:
-
find '.kmz' files containing data in KML format
for individual (or multiple) countries
-
uncompress the '.kmz' files into '.kml' (text) files
-
run a utility script --- a script that will eventually be
in the FE 'Nautilus Scripts' subsystem, in a 'MAPtools'
group of shell scripts --- to 'fold' long lines into
shorter lines and to remove most of the XML-like markup
language in the files
-
manually edit each of the reformatted-and-reduced
files into a simple text file with a title comment
line (or two) --- and data lines consisting of
2 (or 3) columns of numbers (longitudes and
latitudes, in decimal degrees)
We allow an optional z (elevation) coordinate ---
and even comments on the ends of the lines --- that
may be ignored by the FE 'MAPtools' tkGooies that
read the outline files.
Various Data Resolutions
(from rather-crude to excellent)
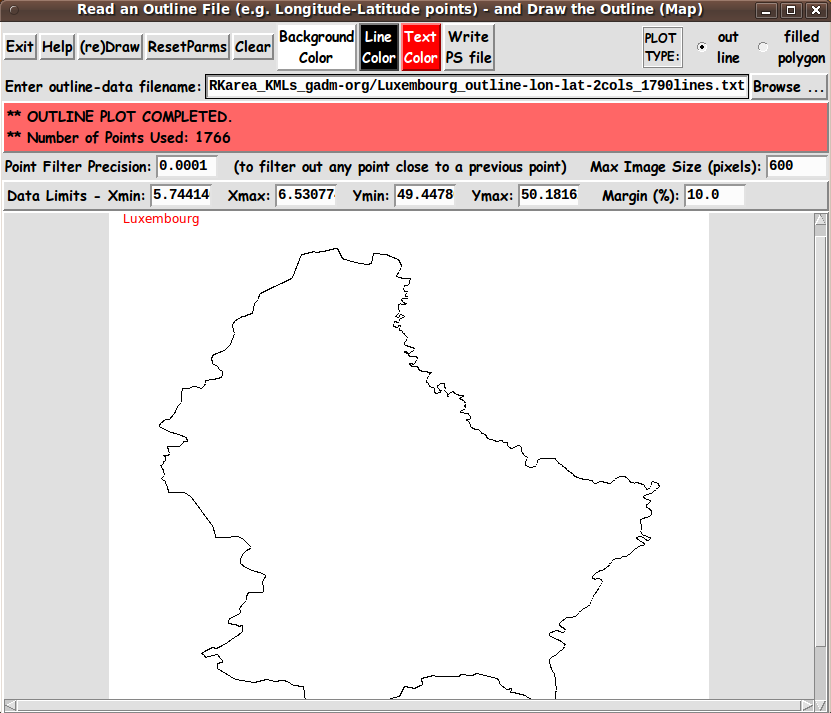
For each country, there may be several outline files (below) of
different 'resolutions'.
The filename of each file includes the number of lines
in the file.
That number is an indication of the number of data lines
(point definitions) in each file --- and includes number
of comment lines.
The more lines in the file, the more data points.
More data points means that a plot of the sequences
of points will (usually) yield a map outline with more detail.
---
Note that you can estimate the number of points
that you will need to get a high-quality outline
of the country.
Nowadays, the maps are often rendered on a display screen with
a resolution of about 1024 x 768 pixels or 1920 x 1080 pixels ---
with the resolution trending upward year by year.
Let us take the case of a 1024 x 768 pixel computer monitor.
Say we want to render a map in a web browser window on that
display.
If the user has the web browser window maximized,
a map of about 800 x 600 pixels would probably fit nicely
within the margins of the web browser viewport.
If we are dealing with a map of a country that is rather
rectangular in shape and with about an 8-to-6 aspect ratio,
then --- if there are not a lot of inlets/jaggies along the
borders of that country --- we would need a maximum
of about
800 + 600 + 800 + 600 = 1600 + 1200 = 2800 points
around the border of the country --- to give a really
accurate rendering of the border on the monitor screen.
Actually, that would usually be overkill.
If we had point coordinates about every 4 pixels
around the border, and we connected those points
with straight line segments, we would
probably find that we get a quite good-looking map.
So about 2800 / 4 = 700 points might give a pretty good map.
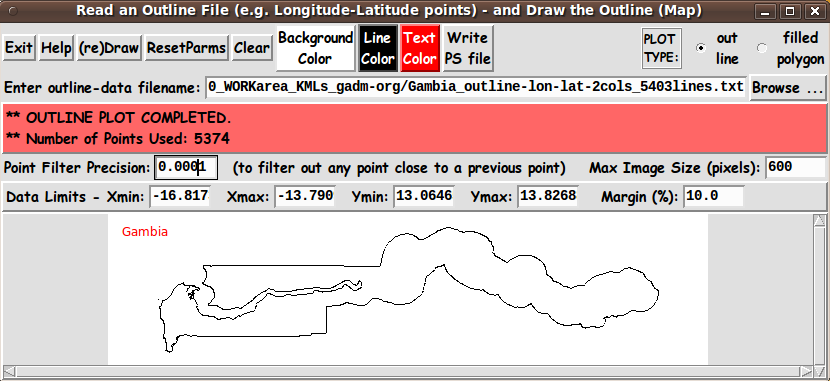
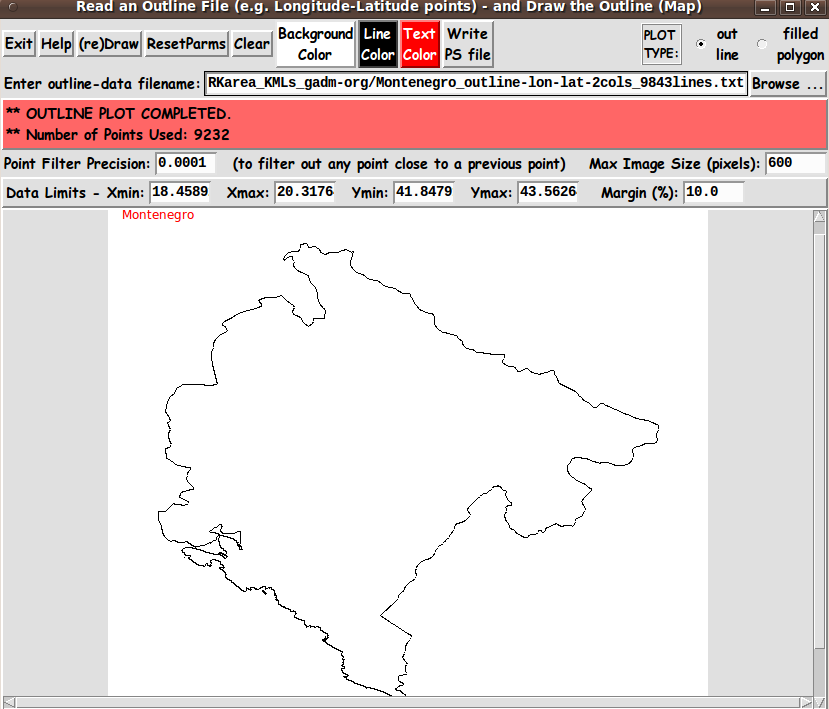
On the other hand, if there are a lot of jaggies around the
periphery of the country (lots of inlets and/or peninsulas, say),
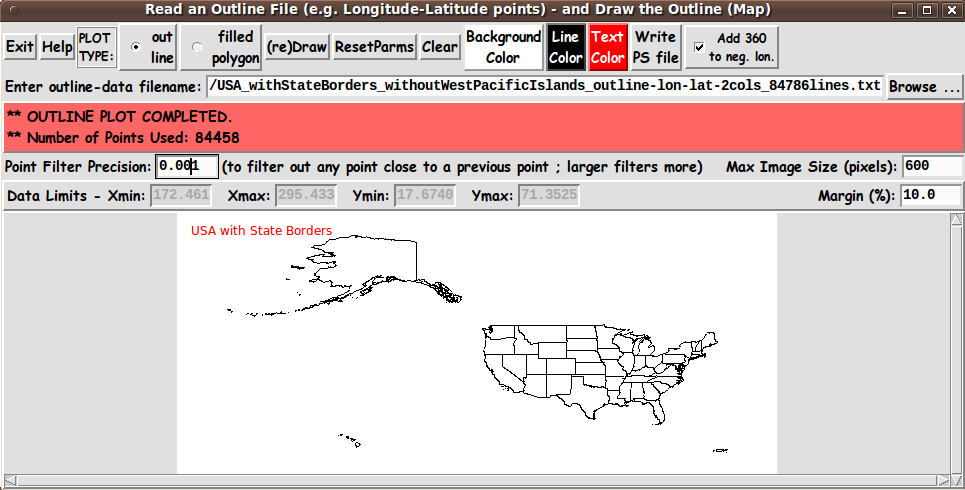
we may need up to around 10,000 points to get a 'fine-grained'
map image --- like the image at the top of this page.
In summary, for outline maps of countries, we will probably
want to use from a few hundred to about 10,000 points to
draw outline maps.
Note that for country-files which include borders of interior
entities such as states, provinces, or counties, then more than
10,000 points may be required for good definition of all the
borders --- say 50,000 or 80,000 points.
In the map files below, we may eventually want to have
several file 'resolutions' for each country --- 'crude',
'good', and 'excellent' files --- say about 200 points,
1500 points, and 10 thousand points, respectively.
(And more points for those files that contain
state/province/county borders.)
---
Note that you can easily estimate the file sizes
--- in kilobytes --- of each of these crude, good, and
excellent files --- from the number of points in the file.
If each number in the file is expressed to about 10 significant
digits, that means that there are about 23 characters in each
data line of the file (counting 2 decimal points and a space
or comma separating the 2 numbers).
Then the file sizes will be
-
'crude' = 200 points(lines) x 23 bytes/line = 4.6 kilobytes
-
'good' = 1500 points(lines) x 23 bytes/line = 34.5 kilobytes
-
'excellent' = 10,000 points(lines) x 23 bytes/line =
230 kilobytes = 0.23 Megabytes
Data 'Loops'
Some maps may contain outline 'loops' --- representing
islands --- or bodies of water (like lakes).
The loops are indicated in the data files by a blank or
comment line between sequences of data lines.
A comment line is indicated by a '#' character in column
one of a file line.
Presentation of the files
(How to use these files)
The files (following) are offered in alphabetical order by country name.
The following 'table of contents' (table of links) offers
a way to quickly jump to a section of countries starting
with the same first letter.
You can either
-
click on a filename to view a file, or
-
'right-click' on a filename, and, in a popup option
menu, choose an option like
'Save Link Target As ...'
to download a file.
Lists of countries
Here is
a list of over 250 country/administrative-area names.
There are 'outline-data' files below for a majority of
these names.
Here is an alternative list of countries (and 'administrative
areas') --- about 250 --- with their longitude-latitude location.
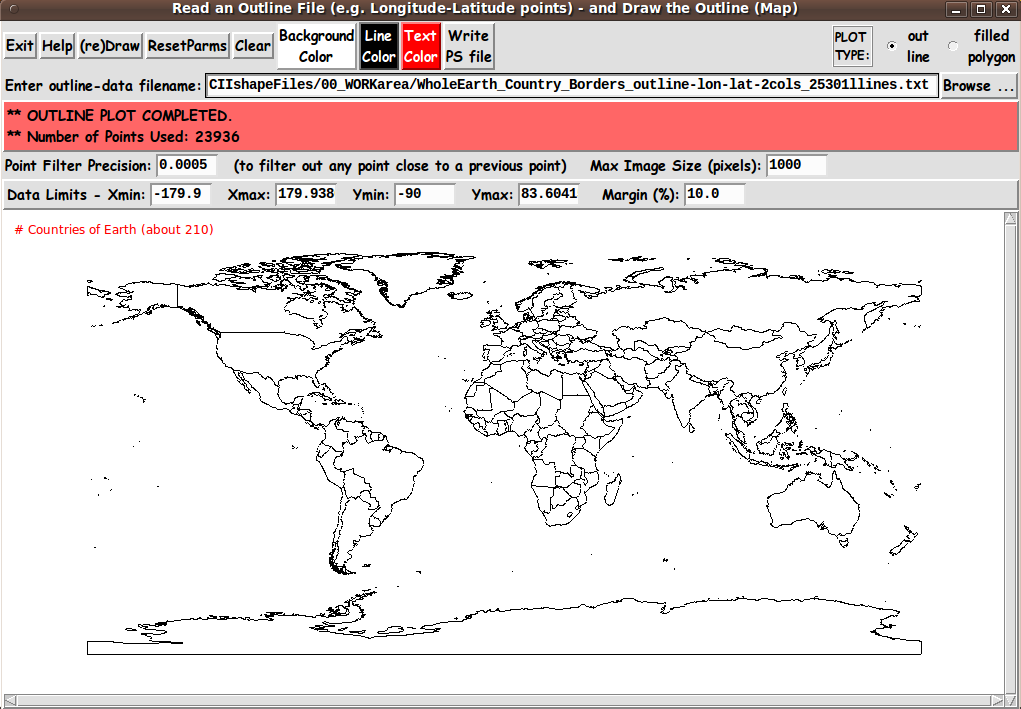
When the border data of countries are gathered together
to do a plot of the Earth's countries, usually the data from
no more than about
180 countries is used.
Here is a list of
about 180 countries gathered into regions of Earth.
|