FE 'tkGooies'
'MAPtools' group
Tk GUI script
'tkReadOutlineFile_ drawOutlineOnCanvas'
FE 'tkGooies''MAPtools' group
Tk GUI script
|
FE Home Page >
FE Downloads Page >
FE 'tkGooies' Description Page >
FE 'tkGooies' 'MAPtools' MENU Page >
This
'tkReadOutlineFile_ drawOutlineOnCanvas'
Code Page
|
INTRODUCTION to Tcl-Tk script For several years (circa 2014-2016), I had been planning to make various 'map making' Tk GUI's that
And, eventually, I would like to develop additional map utility GUI's that allow for reading a 'marker-locations' file and then apply markers to a previously created map image (vector-map or tiles-map). On this page, I present my first map-making 'tkGooie' script --- to make 'vector' maps from outline-data files in a simple format. Each line of the input outline-file is to contain x,y coordinates (which may be a longitude-latitude pair, in decimal degrees). Note that the outline data in the file does not have to be longitude-latitude map data. It could be pairs of coordinates that provide an outline of almost any object --- for example, a silouette of a person or an animal or an insect or a fish. OR, the data file could provide an outline of a logo --- or a group of alphanumeric characters in one or more font styles. OR, the data file could provide vertex coordinates of a geometric figure like a pentagon or hexagon or octagon. OR, a more complicated geometric figure could be defined by the points in the file --- such as a fractal-like geometric figure, like the 3rd or 4th level of a 'Koch Snowlake'. In fact, the outline data could depict a snowflake --- or flower petals --- or the outline of a leaf --- or the outline of tree branches. Use your imagination.
SOURCES OF OUTLINE DATA : The x,y data in the input file (which MAY be longitude,latitude data) is assumed to be in human-readable ASCII format, NOT binary ('ones-and-zeros', 'machine-readable') format. There are many outline (boundary) data files on the internet --- in *ASCII* (non-binary) format --- for continents, countries, regions, states, counties, provinces, etc. Examples:
There is a lot of XML-like markup language in '.geojson' and '.kml' files (uncompressed '.kmz' files). For input to this utility, the user can take those files and 'clean them up' so that there are only a pair of space-separated (or comma-separated) decimal numbers at the start of each line. The input file can contain a few comment lines indicated by '#' in column one of each comment line --- typically one (or a few) comment lines at the top of the file that describe the contents of the file --- and that, optionally, document the source of the data.
NOTE: In '.kml' files, the x,y data is between <coordinates> and </coordinates> markers. This 'tkReadOutlineFile' utility is written to read input files in very simple, minimal format --- x,y ASCII decimal number pairs on each data line --- without any XML-like markup language in the input file. There will be shell scripts in the 'FE Nautilus Scripts' subsystem that extract and re-format (to one x,y point per data line) the x,y coordinate pairs from KML and GeoJSON files --- with very few 'left-overs' (XML tags).
NOTE: You can think of the LONGITUDE value as providing the X-distance along the equator of a planet, and the LATITUDE value as providing the Y-distance from the equator to a north or south pole. The LONGITUDE angle is usually specified between -180 and +180 degrees --- from a zero longitude (like the longitude line through Greenwich, England on Earth). The LATITUDE angle is usually specified between -90 and +90 degrees, measured from the equator. If you want more information on KML or GeoJSON files, you can do a WEB SEARCH on keywords like Basic Goals of the Tk Script: My purpose for this Tk GUI script is/was to plot the x,y points in a rectangular area of a Tk canvas --- by connecting each point to the previous point --- with a straight line segment. The GUI is/was to allow several options to the user:
PLANNED LAYOUT OF THE GUI: As I have done with other Tk scripts that I have written in the past year or so, I laid out a 'text image' of the GUI --- to aid me as I coded the frames and widgets. I used the following conventions to make the sketch, with a text editor. |
  SQUARE-BRACKETS indicate a comment (not to be placed on the GUI).
  BRACES          indicate a Tk 'button' widget.
  A COLON         indicates that the text before the colon is on a 'label' widget.
  <---O--->       indicates a Tk 'scale' widget (if any).
  CAPITAL-X       indicates a Tk 'checkbutton' widget (if any).
  CAPITAL-O       indicates a Tk 'radiobutton' widget (if any).
  UNDERSCORES     indicate a Tk 'entry' widget (if any).
|
According to those conventions, I created the following 'text sketch'. |
 FrameNames
 VVVVVVVVVV
             ------------------------------------------------------------------------------------------
             Read an Outline File (e.g. Longitudes-Latitudes) - and Draw the Outline (Map)
             [window title]
             ------------------------------------------------------------------------------------------

 .fRbuttons   {Exit} {Help} {(re)Draw} {Reset   {Clear} {Background  {Line   {Text   {Write     Draw   O out   O filled
                                        Parms}             Color}     Color}  Color}  PS file}  type:    line    polygon

 .fRfile      Enter outline-data filename: ______________________________________________ {Browse...}

 .fRmsg       [ ..........  Messages go here, in a label widget .................................... ]

 .fRparms     Precision Filter: 0.01___ (to filter out any point close to a previous point)  Max Image Size (pixels): 600__
                                        [a label here contains the text above]

 .fRlimits    Rectangular Plot Limits: Min-X: -45.0___  Max-X: 45.0___  Min-Y: -45.0___  Max-Y: 45.0___

 .fRcanvas    |--------------------------------------------------------------------------------------A
              |                                                                                      |
              |     [This scrollable canvas contains the rectangular 'map' image.]                   |
              |                                                                                      |
              |                                                                                      |
              |                                                                                      |
              |                                                                                      |
              |                                                                                      |
              |<------------------------------------------------------------------------------------>V
|
Perhaps some aspects of the sketch could use a little more explanation: |
  A combination of VERTICAL-BAR CHARACTERS AND HYPHEN (or UNDERSCORE) CHARACTERS,
  that outline a RECTANGULAR SHAPE, are used to indicate either a Tk 'canvas' or
  a Tk 'listbox' widget or a Tk 'text' widget.

  A LINE (HYPHENS or VERTICAL-BARS) WITH AN 'ARROW-HEAD' AT EACH END indicates
  a Tk 'scale' widget --- or a 'scrollbar' widget.

  SCROLL-BAR 'ARROW-HEADS' (for a 'canvas', 'listbox', or 'text' Tk widget)
  are drawn as follows:

   UP    ARROW-HEAD   is drawn with a CAPITAL-A.
   DOWN  ARROW-HEAD   is drawn with a CAPITAL-V.
   LEFT  ARROW-HEAD   is drawn with a LESS-THAN sign.
   RIGHT ARROW-HEAD   is drawn with a GREATER-THAN sign.

  UP-and-DOWN    ARROW-HEADS  at the right/left of a box shape indicate
  a VERTICAL SCROLL-BAR there.

  LEFT-and-RIGHT ARROW-HEADS  at the bottom/top of a box shape indicate
  a HORIZONTAL SCROLL-BAR there.

  The arrow-heads on a horizontal scrollbar are joined by hyphens, rather than
  underscores.
|
From the diagram above, I could see that this GUI will contain about:
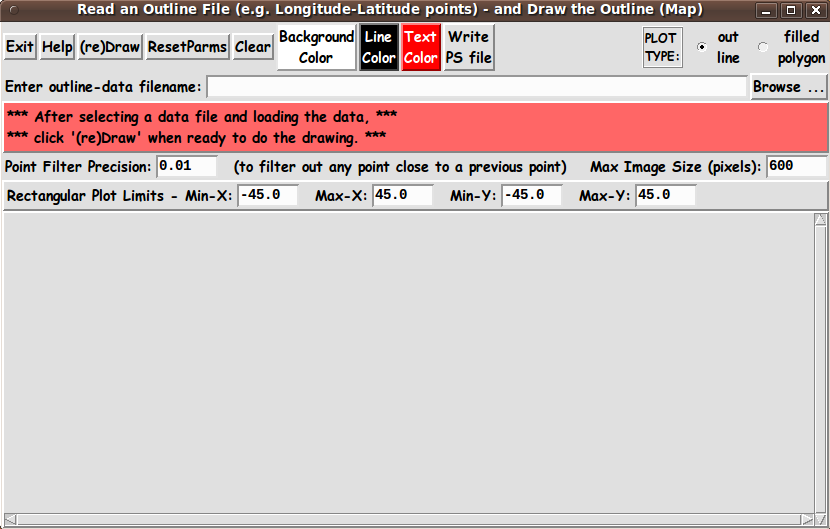
Assembling the pieces (The GUI) Now it was a matter of putting the pieces together. I took 'code-pieces' from some of my other Tk scripts that 'draw' in an image area on a Tk canvas --- in particular, from my Varignon's Theorem script. I ended up with the following GUI as an initial display, when the GUI is started up. |
|
Note that I have provided 3 color buttons on the GUI so that the user can control :
The message lines just below the filename entry field indicate that the first step for the user is to choose an outline data file to process. The following image shows that a filename has been selected. It is in the filename entry field, but the data has not been read yet. The message lines indicate that the user can cause the data to be read by using the Return/Enter key or by clicking on the filename entry field using MouseButton3 (a 'right-click'). |
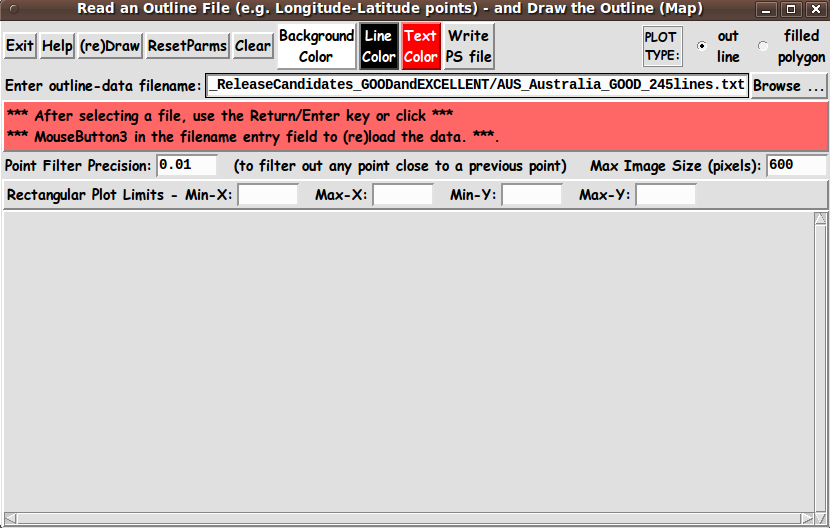
|
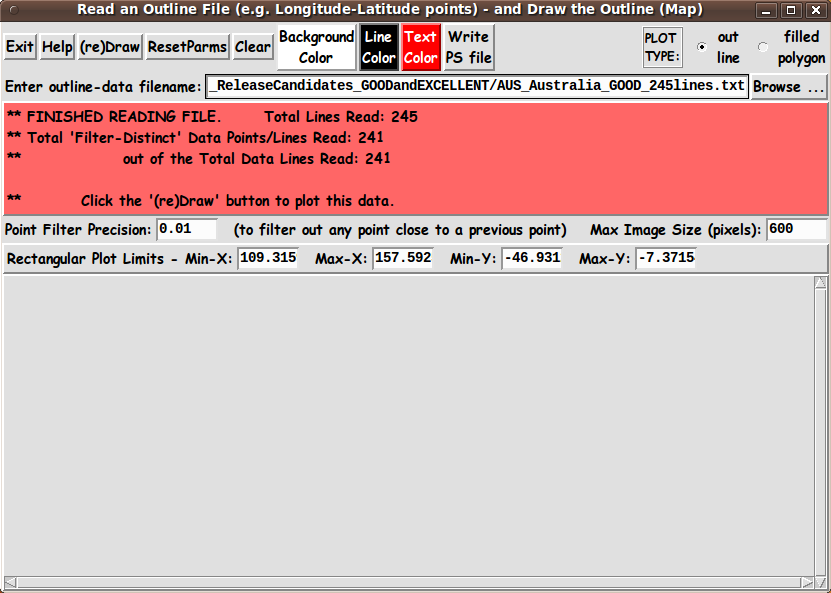
An advantage to using MB3 rather than Return is that one can do most of the operations with this GUI by using mouse-clicks, rather than using a hand on the keyboard. Allowing for a reload of the data from the filename that is still in the entry field can be useful if one needs to edit the file to change some data and then quickly replot from the same file. --- The image below shows that after the data is loaded, the message area shows some statistics about
|
|
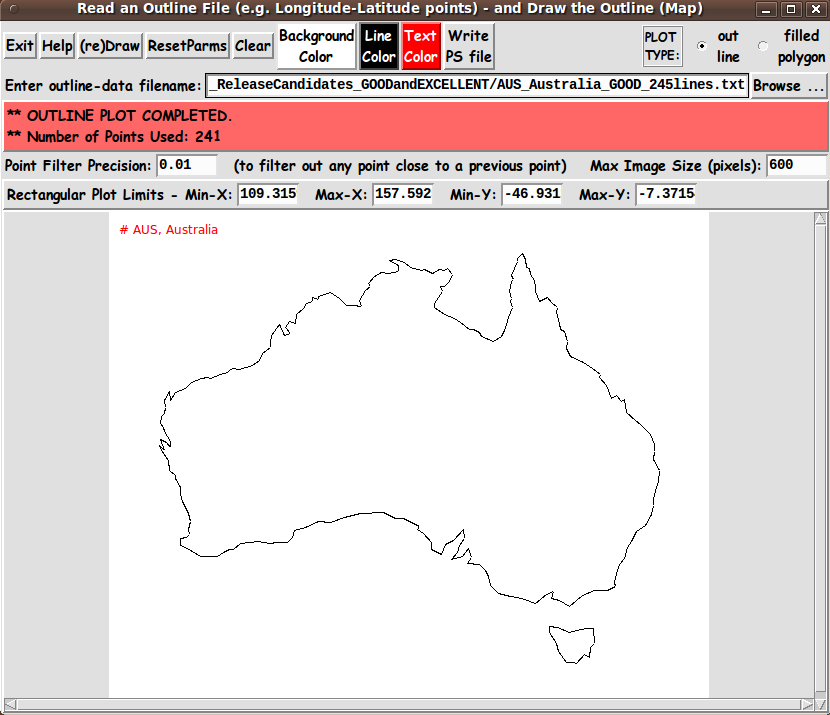
Note that the Xmin,Xmax,Ymin,Ymax entry fields were empty until the data was loaded (read from) the chosen file. The min-max values are determined from the data in the file. Ordinarily, the user will simply click on the 'ReDraw' button without changing the min-max values. But the user can 'tighten up' these values in order to plot a subset of the data points. --- The 'Point Filter Precision' value can be raised to use fewer points in drawing the outline --- or reduced to include more points in the outline. The script skips loading points whose x-value AND y-value is closer than (less than) the 'filter precision' to the previous x,y values. --- Below is an image that was drawn by clicking on the 'ReDraw' button --- to plot the data in the Australia file. |
|
Note that you may want to make the canvas background white if you are going to capture the image and print it to a printer. This will save a lot of ink. Note that you can use the 'WritePSfile' button to write a (color) Postscript file that can be used for printing. (A utility like the 'ps2pdf' command on Linux could be used to make a PDF file from the Postscript file. That command could be built into this script. In fact, the script currently uses the 'evince' command to show the Postscript file that is created. You can edit the script to change the 'set PSviewer' command near the bottom of the Tk script, to use a different viewer.) Alternatively, if the outline fits in the visible canvas area, you can use a screen/window-capture utility (like 'gnome-screenshot' or 'mate-screenshot' on Linux) to capture the image in a PNG file, say. Then you can print the image file using an image viewer utility (like 'eog', Eye of Gnome, or 'eom', Eye of MATE) to print the image. Or use a web browser to open the PNG file. Web browsers usually have well-tested print capabilities for images. Before printing, you could use an image editor (like 'mtpaint' on Linux) to edit the image before printing --- for example, if some cropping were desirable. --- Below is an image drawn from a Brazil outline-data file. For this plot the 3 colors were changed to
|
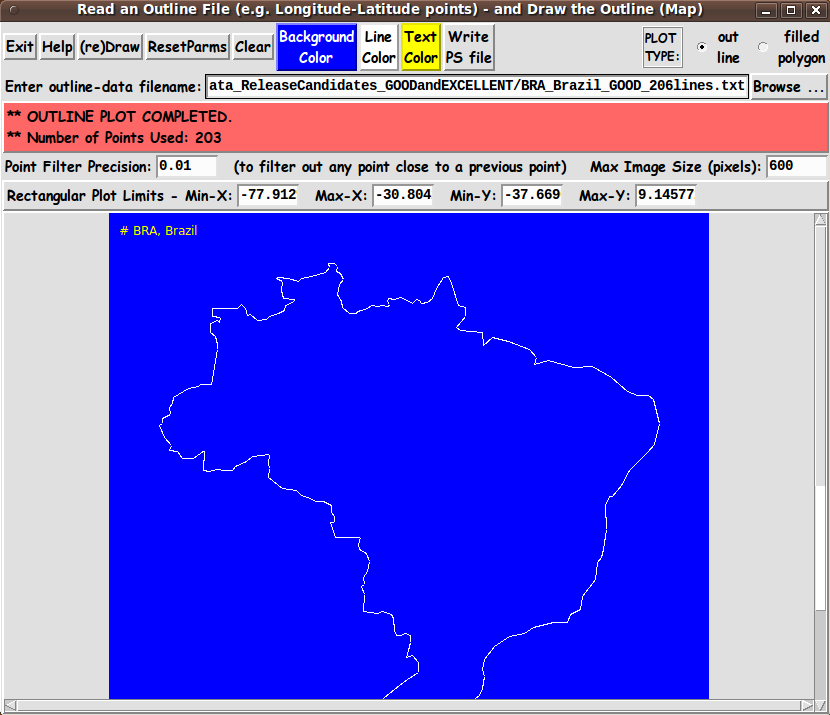
|
This image shows that the scrollbars on the canvas area are handy when the outline exceeds the capacity of the monitor screen. If you want to reduce the size of the plot, you can change the 'Image Size (pixels)' entry field from 600 to a smaller value like 400 or 300.
Execution time: It turns out that most countries --- even countries with a 'ragged' boundary, like Australia or Brazil --- will have a pretty nice outline with about 200 to 250 data points. It is gratifying that the plots of such small data files are done almost instantly --- thanks to the wonderful implementation of Tk canvas plotting in the 'wish' interpreter and the wonderful 'byte-code' implementation of the interpreter process. Even the following plot of a Malta outline file containing 5,024 longitude-latitude points was drawn almost instantly after clicking on the 'ReDraw' button. |
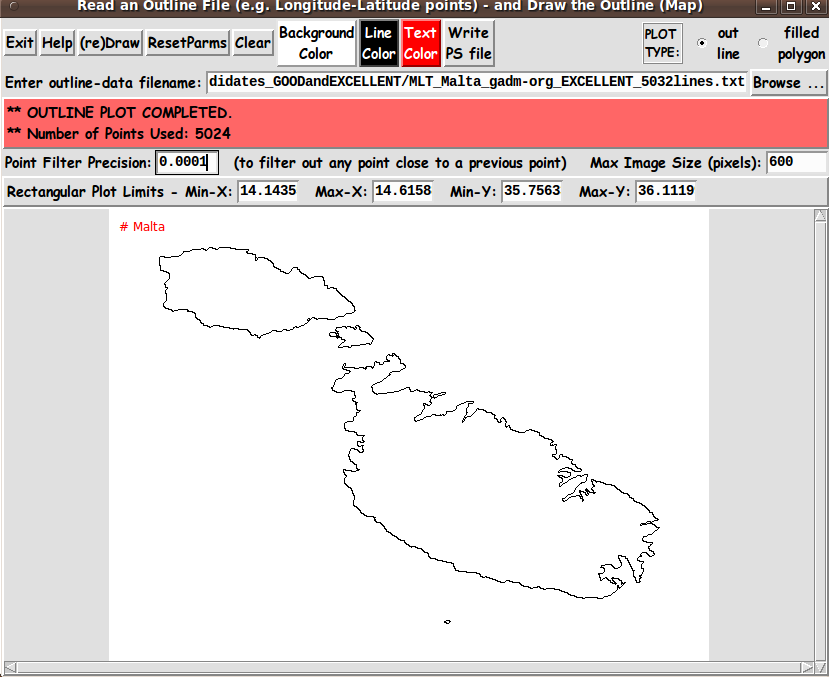
|
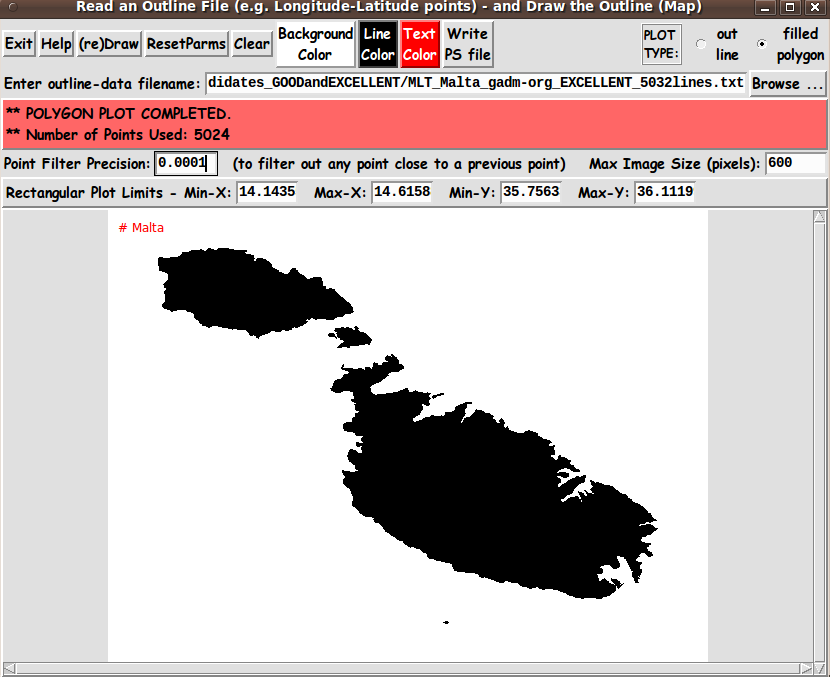
AND ... the following 'filled-polygon' plot of the Malta outline file containing 5,024 longitude-latitude points was ALSO drawn almost instantly after clicking on the 'ReDraw' button. |
|
Note that to get this image, I changed the radiobuttons at the top right of the GUI from 'outline' to 'filled polygon'. Note that even separate 'loops' like islands (in the Malta and Australia plots) are handled by this 'tkGooie' script. (The 'loops' are simply indicated in the data files by a comment or empty line separating one 'loop' from a previous 'loop'.) Implementing the Color Buttons The 3 color buttons call on an 'external' color-selector-GUI script to set those colors. You can make that color-selector script by cutting-and-pasting the code from the page that offers a non-obfuscated color selector GUI on this site. You can see the code at the bottom of this 'tkReadOutlineFile_ drawOutlineOnCanvas' script to see how the name and location of the color selector script is set. DESCRIPTION OF THE CODE Below, I provide the Tk script code for this 'tkReadOutlineFile_drawOutlineOnCanvas' 'app'. I follow my usual 'canonical' structure for Tk code, for this Tk script: |
  0) Set general window & widget parms (win-name, win-position,
     win-color-scheme, fonts, widget-geometry-parms, win-size-control).

  1a) Define ALL frames (and sub-frames, if any).
  1b) Pack   ALL frames and sub-frames.

  2) Define & pack all widgets in the frames, frame by frame.
              Within each frame, define ALL the widgets.
              Then pack the widgets.

  3) Define keyboard and mouse/touchpad/touch-sensitive-screen action
     BINDINGS, if needed.

  4) Define PROCS, if needed.

  5) Additional GUI initialization (typically with one or more of
     the procs), if needed.
|
This Tk coding structure is discussed in more detail on the page A Canonical Structure for Tk Code --- and variations. This Tk coding structure makes it easy for me to find code sections --- while generating and testing this script, and when looking for code snippets to include in other scripts (code re-use). Experimenting with the GUI As in all my scripts that use the 'pack' geometry manager (which is all of my 100-plus Tk scripts, so far), I provide the four main 'pack' parameters:
on all the 'pack' commands for the frames and widgets. I think I have found a good setting of the '-side', '-anchor', '-fill', and '-expand' parameters on the 'pack' commands for the various widgets of this GUI. In particular ... The filename 'entry' widget will expand/contract appropriately when the GUI window size is changed --- and button, radiobutton, and label widgets stay fixed in size and relative-location as the window size changes. If anyone wants to change the way the GUI configures itself as the main (top-level) window size is changed, they can experiment with the '-side', '-anchor', '-fill', and '-expand' parameters on the 'pack' commands for the various widgets --- to get the widget behavior that they want. --- Additional experimentation with the GUI: You could change the fonts used for the various GUI widgets. For example, you could change '-weight' from 'bold' to 'normal' --- or '-slant' from 'roman' to 'italic'. Or change font families. In fact, you may NEED to change the font families, because the families I used may not be available on your computer --- and the default font that the 'wish' interpreter chooses may not be very pleasing. Furthermore, there are variables used to set geometry parameters of widgets --- parameters such as border-widths and padding. And you could change the '-relief' values for frames and widgets. Feel free to experiment with those 'appearance' parameters as well. Some features of the code There are plenty of comments in the code to describe what most of the code-sections are doing. See the top of the 'PROCS' section of the script for a list of the procs used in this Tk script. See comments in the procs for details on the purpose of each proc and for details on the methods by which each proc was implemented. Here is a quick overview of the procs --- to give an idea of the 'guts' of this utility: |
   - 'get_filename'              - called by the 'Browse...' button

   - 'read_file'                 - called by bindings on the filename entry field

   - 'reDraw'                    - called by the '(re)Draw' button

   - 'reDraw_outline'            - called by the 'reDraw' proc

   - 'reDraw_polygon'            - called by the 'reDraw' proc

   - 'reset_parms'               - called by the 'ResetParms' button

   - 'setMappingVars_for_px2wc'  - called by proc 'reDraw'.

   - 'Xpx2wc'                    - called by the 'Draw' procs.
   - 'Ypx2wc'                    - called by the 'Draw' procs.

   - 'set_background_color0'     - called by the 'BackgroundColor' button.

   - 'set_line_color1'           - called by the 'LineColor' button

   - 'set_text_color1'           - called by the 'TextColor' button

   - 'update_color_buttons'      - sets background & foreground color of
                                   either of the 3 color buttons.

   - 'advise_user'               - called by 'get_filename' and 'reDraw' procs
                                   and in the 'Additional GUI Initialization'
                                   section at the bottom of this script

   - 'clear_canvas'              - called by the 'Clear' button

   - 'edit_inputs'               - called by the 'read_file' proc

   - 'decimal_check'             - called by 'edit_inputs' proc

   - 'numeric_check_string_double' - called by proc 'read_file'

   - 'popup_msgVarWithScroll'    - called by the 'Help' button.
|
A fervent hope It is my hope that the copious comments in the code might help Tcl-Tk coding 'newbies' get started in making GUI's like this. Without the comments --- especially in the 'read_file' proc and in the various 'draw' and 'px2wc' procs --- the code might look even more cryptic than it already is. Without the comments, potential young Tcler's might be tempted to return to their iPhones and iPads and iPods --- to look for videos of TV news organizations interviewing politicians and their 'surrogates' and their 'experts' (and the journalists NOT asking obvious follow-up questions). Examples:
Potential Tclers: When you get tired of looking at devoid-of-common-sense-TV-interviews with-politicians-and-the-like, try installing-using-changing-enhancing the following Tk GUI script. To help out in making scripts like this, here is a page that provides sources of Tcl-Tk code snippets by providing links to various 'tkGooies' scripts that can make it relatively quick work to compose
And when you get to the testing-and-debugging phase in development of a Tk script, here is a page that describes the wonderfulness of the 'wish' 'stack trace' facility, which can make the testing-and-debugging go relatively quickly and painlessly. The Tk Script CODE Here is a link to CODE for the Tk script 'tkReadOutlineFile_ drawOutlineOnCanvas.tk'. With your web browser, you can 'right-click' on this link --- and in the menu that pops up, select an item like 'Save Link Target As ...' --- to save this file to your local computer. Then you can rename the file to remove the '.txt' suffix. Make sure that you have execute permission set on the file --- in order to execute the script. |
|
Some possible FUTURE ENHANCEMENTS There are some enhancements that could be considered for this script, such as:
Speaking of enhancements, I may make some changes to the way that the Xmin, Xmax, Ymin, Ymax entry fields are initialized and used --- as I use this outline-map-making 'tkGooie' to test sample outline-data-files that I generate and post on the Outline Data Sources page. You can check back, on occasion, to see whether I have changed the code for this 'tkGooie' (at the code-link above). I usually document changes, in 'Changed by:' lines at the bottom of the top (big) comments section at the top of the Tk script. That is a quick way to see if I have changed the script. --- The bottom line here is that there are almost always enhancements that could be made to (or 'forks' that could be made from) a Tk GUI 'app' like this. One advantage of this Tk script is that it is 'open' code --- available to anyone for enhancement. So if you would like to take a different approach to implementing this script, you are welcome to take this code and build on it (or reconstruct it). IN CONCLUSION As I have said on other code-donation pages on this site ... There's a lot to like about a utility that is 'free freedom' --- that is, no-cost and open-source so that you can modify/enhance/fix it without having to wait for someone else to do it for you (which may be never). A BIG THANK YOU to Ousterhout for starting Tcl-Tk, and a BIG THANK YOU to the Tcl-Tk developers and maintainers who have kept the simply MAH-velous 'wish' interpreter going. |
|
Bottom of this web page that To return to a previously visited web page location, click on the Back button of your web browser a sufficient number of times. OR, use the History-list option of your web browser. OR ...
< Go to Top of Page, above. >Page history:
This FE web page was created 2016 Nov 29.
NOTE: |