|
INTRODUCTION :
The following 'non-map outline files' were created from
SVG
(Scalable Vector Graphics) files using a rather tedious process
--- such as the following for SVG files:
-
Find '.svg' files containing data in SVG ASCII text format
--- preferably files using drawing commands in 'absolute'
mode rather than 'relative' mode.
NOTE:
The SVG drawing commands for 'move' and 'line' are
'M' and 'L' when absolute coordinates are used --- and 'm' and 'l'
when relative coordinates are used.
-
Run a utility script --- a script that will eventually be
in the FE 'Nautilus Scripts' subsystem, in a 'MAPtools'
group of shell scripts --- to 'fold' long lines into
shorter lines and to remove most of the XML-like markup
language in the files.
-
Manually edit a reformatted-and-reduced
file into a simple text file with a title comment
line (or two) --- and data lines consisting of
2 columns of numbers (x and y coordinates ---
decimal or integer numbers) --- with comment lines
indicating separate data 'loops'.
The comment lines are indicated by a hash-sign (#) in column 1.
'Outline' files in this simple format are readable by the
FE 'MAPtools' tkGooies.
Various Data Resolutions
(from rather-crude to excellent)
Since each data point (an x,y coordinate pair) is on one line of
these 'outline' files, the number of lines in the file is a
good estimate of the number of data points in the file.
(There are generally just a few comment lines in the files ---
all the other lines are data-point lines.)
The more lines in the file, the more data points.
More data points means that a plot of the sequences of points
will (usually) yield an outline with more detail.
---
Most of the files below contain between 90 and 2,200 data points.
This is generally enough points to give some fairly good
quality images.
Generally, about 10,000 points will provide a quite
detailed outline of complex figures on a computer screen.
But, if you just want a rough-to-good indication
of the outline of an object, a few thousand points ---
or several hundred --- or less --- may do.
You can get quite detailed outlines using only
250 points.
Data 'Loops'
Some drawn figures will contain outline 'loops' --- representing
anatomical features (such as eyes or mouth) or geometric features
(such as holes or protrusions on machinery).
In outline files for maps, the 'loops' correspond to features
such as lakes or islands.
The loops are indicated in these 'outline' data files by
a blank or comment line between sequences of data lines.
The first x,y coordinate pair is the same as the last
x,y coordinate pair in the loop.
A comment line is indicated by a '#' character in column
one of a file line.
Eventually, the tkGooie 'MAPtools' may support a
hex color code on a comment line
to indicate the color for the following data loop ---
the color of its outline or its 'fill' color.
Example: #ffaa33 for a brownish color
Presentation of the files
(How to use these files)
The files (following) are offered in several groups ---
animals, people, and inanimate-objects.
The following 'table of contents' (table of links) offers
a way to quickly jump to one of these sections.
In any of these sections of file-links, you can either
-
click on a filename to view a file, or
-
'right-click' on a filename, and, in a popup option
menu, choose an option like
'Save Link Target As ...'
to download a file.
Some drawing issues
(and tkGooie enhancements)
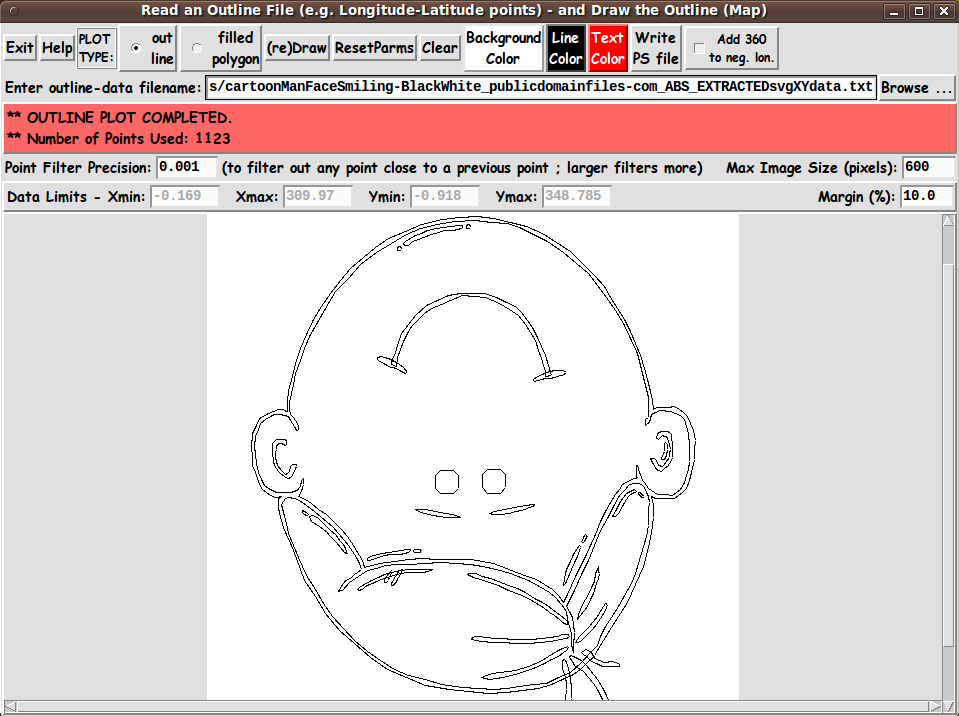
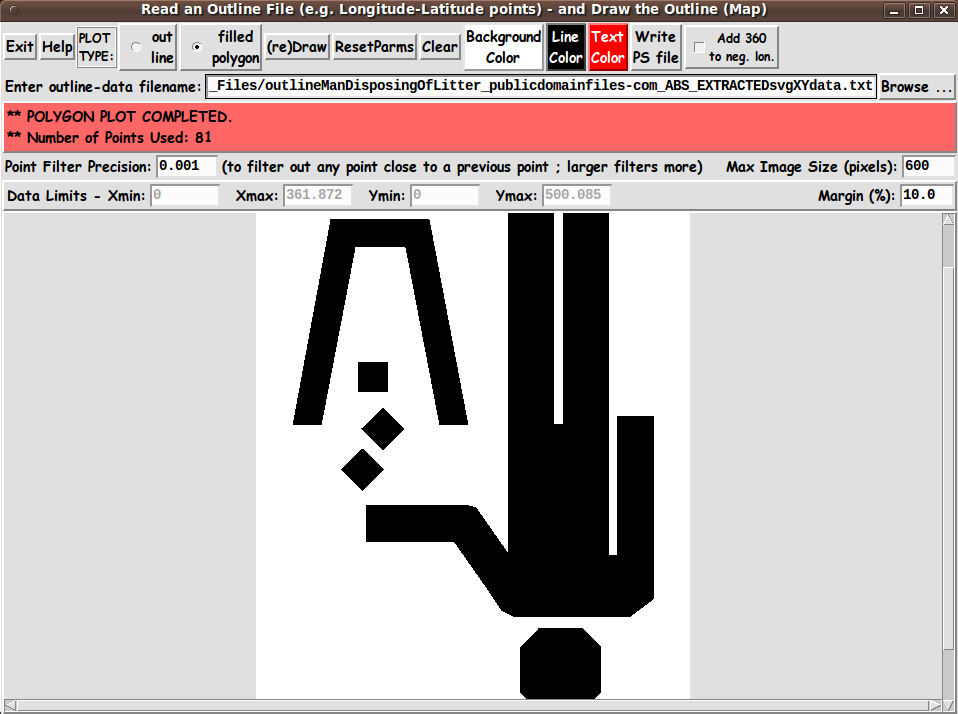
You can see (from some images on this page) that the plots of some
of these outline files with the
'tkReadOutlineFile_ drawOutlineOnCanvas'
tkGooie script
yield an upside down image.
In the future, a checkbutton may be added to this tkGooie,
to allow the user to flip the sign of the y-coordinates as they
are read from the outline file.
This is probably the easiest way to handle this issue.
In the meantime, a screen capture of the image can be done ---
and then the captured-cropped image can be flipped 180-degrees
with an image editor or with a script, such as a 'ROTATE' script
in the
'IMAGEtools' group of the 'feNautilusScripts' system.
Enough introduction.
Here is the 'Table of Contents'.
|