FE 'tkGooie' Utilities

'SYSTEMtools' group

A Meter for
CPU(s) Usage utility

(drawn in a
Tachometer Style)

(FE = Freedom Environment)

GUI to show CPU usage
for one or ALL CPU's
on a computer, using
a tachometer-style
meter --- drawn using
'create arc' and
'create oval' and
'create line' and
'create text' on a
Tk 'canvas' widget.

FE Home Page > FE Downloads Page >

FE 'tkGooies' Description Page >

FE 'tkGooies' 'SYSTEMtools' Menu >

This
'Meter_forCPUsUsage_
drawnTachStyle'
tkGooie code Page

INTRODUCTION to a Tcl-Tk script
'Meter_forCPUsUsage _drawnTachStyle'

In mid-2013, I put it on my Tk-scripts 'to do' list to implement some practical applications for the nice 'tachometer style' meter for which Marco Maggi provided a demo script at wiki.tcl.tk/9107 back in 2003.

I have implemented three applications of this meter to:

In the first case, the Tk script was essentially a 'wrapper' for the 'free' command, which is available on my operating system (Ubuntu 9.10, 2009 October, 'Karmic Koala').

In the 2nd case, the Tk script was essentially a 'wrapper' for the 'netstat' (or 'ifconfig') command.

In the 3rd case, the Tk script was essentially a 'wrapper' for the 'df' command.

The code for the memory-and-swap application was 'published' on a Tcler's Wiki (wiki.tcl.tk) page titled 'A Pair of Tachometer-style Meters --- for Memory and Swap'.

The code for the network-activity application was 'published' on a Tcler's Wikie (wiki.tcl.tk) page titled 'A Pair of Tachometer-style Meters --- for Network Activity'.

The code for the file-system-usage application was 'published' on a Tcler's Wiki (wiki.tcl.tk) page titled 'A Tachometer-style Meter --- for File System Usage'.

I had one other application of the 'tachometer style' meter on my 'to-do' list --- a CPU-usage monitoring application.

That is the subject of this page.

---

Getting appropriate CPU activity data:

In doing web searches for ways to get CPU activity info on Linux, I found that the file '/proc/stat' has information on the one or more CPU's on a computer --- and one can see that information by using the 'cat' command.

Example output of 'cat /proc/stat' ... from a computer with 2 CPU's :


   $ cat /proc/stat
   cpu  183112 1474 25701 1008114 5609 357 1301 0 0
   cpu0 96100 982 12954 469961 2710 77 88 0 0
   cpu1 87011 491 12746 538152 2898 280 1213 0 0
   intr 3118276 1241284 1838 0 0 0 0 0 0 1 17228 0 0 2573 0 0 0 869 62033 0 0 0 0 0 0 0 0 27446 59166 16612 0 0 ... hundreds of zeros ...
   ctxt 4455035
   btime 1378614163
   processes 2381
   procs_running 2
   procs_blocked 0
   softirq 1569874 0 1120419 10859 10176 27466 4934 307011 551 88458


This output is explained via the 'man proc' command.

See the section that starts at '/proc/stat'.

The first 4 numbers on each 'cpu' line are the amount of time --- measured in units of USER_HZ (approx. 1/100ths of a second on most architectures) --- that the system spent in

  1. user mode,

  2. user mode with low priority ('nice' mode),

  3. system mode,

  4. the idle task,

respectively.

The other numbers on each 'cpu' line are described in 'man proc'.

The time is measured from boot time.

The output from two consecutive queries can be used to get the cpu-activity (user,nice,system,idle) over a sample time interval.

The 'cat /proc/stat' command is used to show the CPU 'ticks' --- sometimes called 'jiffies', which are on the order of 1/100th of a second --- in the categories user-nice-system-idle-etc --- for ALL the CPU's of the computer --- as well as totals for all the CPU's.

Although Unix and BSD systems have many commands --- like 'free' and 'netstat' and 'df' --- that behave almost exactly as they do on Gnu/Linux, the characteristics of the '/proc' file system of Linux may be rather unique.

In other words, to get the following utility to work, one may have to substitute another command wherever the 'cat /proc/stat' command is used.

That command is used in 3 places in a shell script (code shown below).

The Tcl-Tk script, whose code is shown below, serves as a GUI 'wrapper' or 'front end' for that shell script.

    Note that the Apple Mac operating system is based on a BSD system, so if there is a suitable command on BSD systems to get the 'cat /proc/stat' data --- then it may be possible to implement this 'CPU-usage' utility on Apple Mac systems with just a few changes.

Summarizing:

This utility is probably usable on BSD and Mac (and Unix) systems with some changes to the shell script.

And for almost any Linux system with an 8.x Tcl-Tk 'wish' interpreter installed, this utility should be usable with essentially no changes.

---

The number of 'cpu*' lines:

In the example output above, you can see that there are 3 CPU's listed --- 'cpu', 'cpu0', and 'cpu1'.

The data for 'cpu' are totals of the data for the CPU's 'cpu0' and 'cpu1'.

On a home computer with just one CPU, there may be only one CPU-ID in the listing --- 'cpu'.

I don't know for sure myself because my little netbook computers have at least 2 CPU's (cpu0,cpu1) and my main desktop computer has 4 CPU's (cpu0,cpu1,cpu2,cpu3).


Designing the Tk GUI

I decided to go with a single meter on the GUI --- rather than 2 meters, like in the 'memory-and-swap' and the 'network-activity' Tk GUI's that I had devised before.

In fact, I patterned this GUI on the single-meter GUI that I used for the 'file-system-usage' Tk GUI that I devised before.

Besides showing a 'percent-usage' meter (on a Tk canvas on the GUI), I wanted to provide a means for the user to query the CPU ID's available on the computer --- and to choose one of the CPU-ID's to monitor.

And I wanted to provide a Tk 'scale' widget on the GUI, by which the user can specify, at any time, a new 'sampling rate' --- for getting the CPU-activity data via the 'cat /proc/stat' command.

(Actually, the 'sampling rate' is a 'wait-time' = 'wave-length', rather than a 'frequency'.)

I was able to implement that periodic-sampling ability by use of the Tcl 'after' command, in the form

after   $WAITmillisecs   update_needles

This command is issued once to initialize the GUI --- and it is issued within the 'update_needles' proc itself, to continue getting CPU usage data, for a user-specified CPU-ID, via the 'cat /proc/stat' command.

Since, often, the 'ticks' for any of the CPU's are accumulating rather gradually, a sampling rate of at least a couple of seconds is needed to get reasonably accurate %-usage for the low-usage CPU's.

So the 'scale' widget is initialized at a rate of that magnitude.

And since any computer, even one with only one CPU, will probably have the CPU-ID 'cpu' included in the output of 'cat /proc/stat', I decided to initialize the monitoring with the CPU-ID 'cpu'.

I also wanted to supply a 'Refresh' button on the GUI, so that the user can request at ANY TIME, a new query of the usage data for the CPU-ID being monitored.

This is especially helpful if you have the sampling rate set at 10 seconds or more, and you want to intervene immediately to change the sampling rate.

And, in case there is more than one CPU that is quite active, I wanted to supply a 'Report' button on the GUI, so that the user can see, at any time, the usage of ALL the CPU's on the computer --- even a monster computer with 24 or more CPU's.

In putting together the code for this GUI, I drew heavily on the 'shadow-circle' technique of Marco Maggi to make nice looking meters.

And I included a 'red-line' (danger) area on the meter, like he did.

One rather unique thing about this implementation of the meter (something not done by Maggi in his demo) is that the GUI window and the canvas and the meter are resizable.

In other words, I spent quite a bit of effort in converting Maggi's procs

  • FROM using hard-coded numbers for making the meters and their needles

  • TO using variables that are set based on a query on the current size of a frame or canvas widget.

So the user is able to resize the window and click on the 'Refresh' button to get a bigger version of the meter and the needle position.


SOME GUI IMAGES

On the basis of these goals, I ended up with the GUI seen in the following image.

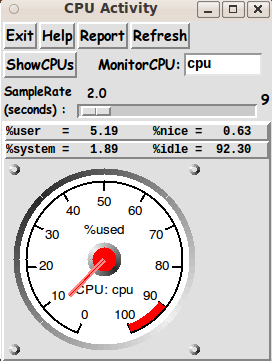
Typically, there are not many 'ticks' accumulating in 'nice mode'.

So most of the 'activity' of a CPU is accumulating in the 'user' and 'system' modes.

I show the '%user' and '%system' numbers stacked above each other in a couple of 'label' widget lines on the GUI.

Their sum will typically be the same as the %CPU value pointed to by the needle.

---

The integer shown just to the right of the 'scale' widget is a sample-count.

I found that it is helpful to have this count displayed in cases when the needle and numbers on the GUI are not changing perceptibly --- so that the user is assured that the sampling is taking place, and at the rate that is currently requested.

---

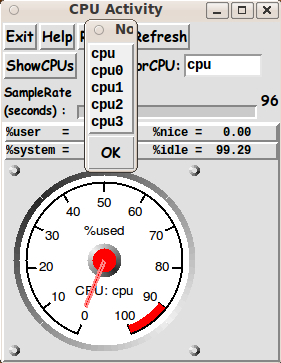
The 'ShowCPUs' button on the GUI can be used to show the available CPU-ID's.

A small window pops up showing a list of CPU-ID's --- as seen in the following image.

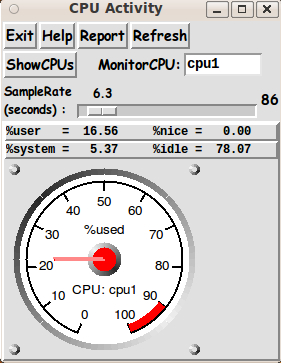
Below is an image that shows that one can change the 'CPU-to-monitor' entry field so that a different CPU-ID is monitored --- in this case the CPU-ID 'cpu1' --- the second of four CPU's on my desktop computer.

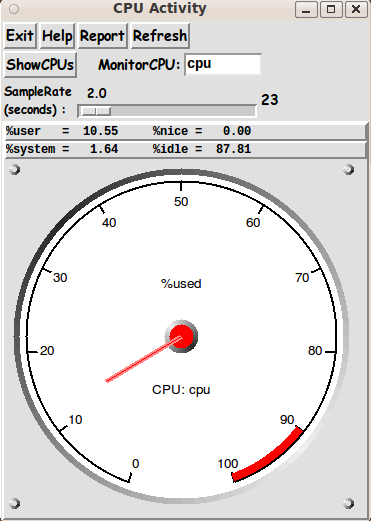
When the GUI first comes up, the meter (its canvas) is sized at about 200x200 pixels --- and the data shown is based on an initial couple of executions of the 'cat /proc/stat' command --- from which data for the 'cpu' CPU-ID is extracted.

The image below demonstrates that the user is able to resize the window and click on the 'Refresh' button to get a bigger version of the meter.

I had hoped to come up with a technique to avoid the 'aliasing' effect on the needles --- but I did not devise a successful technique for any of the 4 tachometer-meter scripts that I have done so far.

However, as 'retina display' monitors come into use more and more (with resolutions above about 2000x1500 pixels), even without changing the needle-drawing code in this script, you may find that the 'jaggies' are hard to see.

(I do not have such a monitor yet, so I cannot say for sure.)


CAPTURING THE GENERATED IMAGE:

When you get an image that you want to save, a screen/window capture utility (like 'gnome-screenshot' on Linux) can be used to capture the GUI image in a PNG or GIF file, say.

If necessary, an image editor (like 'mtpaint' on Linux) can be used to crop the window capture image.

    (The image could also be down-sized with the editor --- say, to make a smaller image suitable for presentation in an email or on a web page.)

This is the technique that I used to prepare the images that I posted above, to show some GUI features of this utility.

However, I replaced the relatively large PNG files that came from the 'mtpaint' editing step with smaller JPEG files that were created by the ImageMagick 'convert' command.


DESCRIPTION OF THE CODE

Below, I provide the Tk script code for this 'CPU-usage' display utility.

I follow my usual 'canonical' structure for Tk code for this Tk script:


  0) Set general window & widget parms (win-name, win-position,
     win-color-scheme, fonts, widget-geometry-parms, win-size-control,
     text-array-for-labels-etc).

  1a) Define ALL frames (and sub-frames, if any).
  1b) Pack   ALL frames and sub-frames.

  2) Define & pack all widgets in the frames, frame by frame.
              Within each frame, define ALL the widgets.
              Then pack the widgets.

  3) Define keyboard and mouse/touchpad/touch-sensitive-screen action
     BINDINGS, if needed.

  4) Define PROCS, if needed.

  5) Additional GUI initialization (typically with one or more of
     the procs), if needed.


This Tk coding structure is discussed in more detail on the page A Canonical Structure for Tk Code --- and variations.

This structure makes it easy for me to find code sections --- while generating and testing a Tk script, and when looking for code snippets to include in other scripts (code re-use).

I call your attention to step-zero.

One thing that I have started doing in 2013 is using a text-array variable --- named 'aRtext' --- for text in labels, buttons, and other widgets in the GUI.

This can make it easier for people to internationalize my scripts.

I will be using a text-array like this in most of my scripts in the future --- in the top part of my Tk scripts.


Experimenting with the GUI

As in all my scripts that use the 'pack' geometry manager (which is all of my 100-plus scripts, so far), I provide the four main 'pack' parameters:

  • '-side'
  • '-anchor'
  • '-fill'
  • '-expand'

on all of the 'pack' commands for the frames and widgets.

That helps me when I am initially testing the behavior of a GUI (the various widgets within it) as I resize the main window.

I think that I have used a pretty nice choice of the 'pack' parameters.

In particular ...

The label and button widgets stay fixed in size and relative-location if the window is re-sized --- while the canvas area (without scroll bars) expands/contracts whenever the window is re-sized, and the 'Refresh' button is poked.

The meter expands/contracts when the window is re-sized --- but perhaps not always in a way you would desire.

Occasionally, you may need to tug the borders of the window to show the meter in a way that suits you.

You can experiment with the '-side', '-anchor', '-fill', and '-expand' parameters on the 'pack' commands for the various frames and widgets --- to get the widget behavior that you want.

And you can look into the code that is drawing the meter to see if you can devise meter-resizing behavior that pleases you more.

---

Additional experimentation with the GUI
--- its appearance:

You might want to change the fonts used for the various GUI widgets.

For example, you could change '-weight' from 'bold' to 'normal' --- or '-slant' from 'roman' to 'italic'.

Or change font families.

    In fact, you may NEED to change the font families, because the families I used may not be available on your computer --- and the default font that the 'wish' interpreter chooses may not be very pleasing.

I use variables to set geometry parameters of widgets --- parameters such as border-widths and padding.

And I have included the '-relief' parameter on the definitions of frames and widgets.

Feel free to experiment with those 'appearance' parameters as well.

If you find the gray 'palette' of the GUI is not to your liking, you can change the value of the RGB parameter supplied to the 'tk_setPalette' command near the top of the code.


Some features in the code

There are plenty of comments in the code to describe what most of the code-sections are doing.

You can look at the top of the PROCS section of the code to see a list of the procs used in this script, along with brief descriptions of how they are called and what they do.

The main procs are as follows.


   'make_tachometers' - to draw one (or more) meters within their Tk (square) canvases.

                        We allow the canvas(es) to resize according to
                        a resizing of the window. This proc will set the
                        SQUARE size of the canvas(es) according to the current
                        size of the frame containing the canvas(es).

   'make_one_tachometer' - called by 'make_tachometers', to make each meter.

                           In this utility, we draw only one meter --- but the
                           procs are structured to facilitate adding another
                           meter, if a Tcl-Tk coder so desired.

   'draw_rivet'          - called by 'make_one_tachometer', 4 times, to put
                           rivets in 4 corners around a meter.

   'draw_circle_shadow'  - called by 'make_one_tachometer' to put a shadowed
                           edge around the circle that makes the meter.
                           Also called to help make a 'pin' in the center of
                           the meter to hold the needle. Also called to make
                           the 4 rivets.

   'update_needles'      - to update the needle(s) on the meter(s).

   'update_one_needle'   - called by 'update_needles', to draw each needle.

   'Refresh'             - called by 'Refresh' button. Runs 'make_tachometers'
                           and 'update_needles'.

   'Report'              - called by 'Report' button.

   'show_cpus'           - called by 'ShowCPUs' button.

   'popup_msgVarWithScroll' - called by the 'Help' button, to show text in
                              variable $HELPtext. Also used by the 'Report'
                              and 'show_cpus' procs.


Thanks to Marco Maggi whose 'shadow-circle' drawing technique and code made this script much easier to write.


Comments in the Code

It is my hope that the copious comments in the code will help Tcl-Tk coding 'newbies' get started in making GUI's like this.

Without the comments, potential young Tcler's might be tempted to return to their iPhones and iPads and iPods --- to watch videos that have been selected by Daniel Tosh or his staff, for showing on his TV show, tosh.0 (tosh-point-zero).


The Tcl-Tk CODE

Here is a link to CODE for the Tk script

'meters_cpus_usage.tk'.


The shell script (the 'wrapee') :

Below is the code for the shell script called by this Tk script.

This shell script is a wrapper script for the 'cat /proc /stat' command.

This script takes a single string-parameter which can be either 'all' or 'cpuslist' or a CPU-ID ('cpu', 'cpu0', 'cpu1', ...).

You can put this script in the same directory with the Tk script.

The Tk script includes some code (involving the 'argv0' variable) to determine the location of the shell script by extracting the name of the directory in which the Tk script lies.

---

Here is a link to CODE for the SHELL script

'get_cpu_usage_info.sh'.


MORE METER UTILITIES:

I may try making a different type of meter utility for the 4 meter utilities for which I used 'tachometer-style' meters based on the code of Marco Maggi --- which used 'create arc', 'create oval', 'create line', and 'create text' Tk canvas commands to create the meters.

A 'create image' technique:

Instead of the Maggi-method, I may try using a 'create image' technique --- along with realistic images of meter backgrounds --- to make HD (high-definition) meters --- thus avoiding the jaggies in the arcs and tic-marks.

Furthermore, I may try an image technique to make a high-quality needle that does not suffer from 'the jaggies'.

One advantage of building the meter with 'create oval,arc,line,text' is that the meter can be resized to ANY size using some simple arithmetic.

If I implement a meter with a 'create image' technique, I may provide small / medium / large images from which the user can choose.

This would allow some choice of size, and yet not incur an odious amount of processing (and/or wait-time for re-display) by trying to re-size an image via CPU-intensive image processing, to scale a single given image.

    (This assumes that it is more efficient to load an image file into memory than to sweep through an in-memory image, averaging-or-whatever the neighboring pixels, to create a new-sized image.

    There is also the problem of creating a good-quality image by scaling a single image up or down --- which argues for using the small / medium / large technique.)

---

A 'moving skyscraper silhouette' technique:

Another type of display that I may try on the Tk canvas is a 'moving mountain-range silhouette' --- which one sees in some 'system monitor' apps, such as 'gnome-system-monitor' (on Linux) -- under the 'Resources' tab, titled 'CPU history'.

This kind of display has the advantage of preserving the recent history of the CPU percentage of one or more CPU's --- about 6 minutes of history across a 180-pixel-wide canvas, if we are sampling about once every 2 seconds.

This type of animated plot could be created with Tk by using a 'create line' technique on the Tk canvas, to plot vertical lines (to create a 'silhouette-type' plot) --- or simply single pixels (to create a 'thin-line-type' plot).

This 'history display' technique may be especially suitable for an alternative version of 3 of the 4 apps that I have implemented:

  • the 'memory-and-swap',
  • the 'network activity', and
  • the 'CPU activity'

apps.

Those are the 3 types of activity shown in the 'Resources' panel of the 'gnome-system-monitor' utility.


They under-estimate you ... Tcl, Tk, and wish

By the way, these 4 Tk Maggi-meter apps using Tcl-Tk *scripting* are much less CPU-consumptive than the *compiled code* 'gnome-system-monitor' program --- thus demonstrating that 'compiled code' is not always faster and more efficient than 'script code'.

When I run 'gnome-system-monitor' and these Tk scripts at the same time, and when I look at the processes running sorted by CPU% (in the gnome-system-monitor 'Processes' panel display), 'gnome-system-monitor' is shown as constantly 'Running' (at 4% CPU, or much more), while the Tk scripts are almost constantly 'Sleeping' (at 0% CPU).

(Thank you, wonderful 'wish' interpreter --- and Gnu/Linux scripting.)

---

Oh, the possibilities we have with Tcl-Tk.

The possibilities are endless ... I say to the 'Tcl is dead' nay-sayers ... those 'nattering nabobs of negativism'.

    For the youngsters reading this, the phrase 'nattering nabobs of negativism' was used by Spiro Agnew in 1970, during the Richard Nixon era.


IN CONCLUSION

As I have said on other code-donation pages on this FE web site ...

There's a lot to like about a utility that is 'free freedom' --- that is, no-cost and open-source so that you can modify/enhance/fix it without having to wait for someone else to do it for you (which may be never).

A BIG THANK YOU to Ousterhout for starting Tcl-Tk, and a BIG THANK YOU to the Tcl-Tk developers and maintainers who have kept the simply MAH-velous 'wish' interpreter going.

Bottom of this web page for
presenting Tcl-Tk and shell script code for
a Meter for CPU(s) Usage
--- drawn Tachometer Style

--- a utility in the FE 'tkGooies' system,
in the 'SYSTEMtools' group.

To return to a previously visited web page location, click on the Back button of your web browser a sufficient number of times. OR, use the History-list option of your web browser.
OR ...

< Go to Top of Page, above. >

Page history:

The code was created in 2013 --- and posted 2013 Dec 05 at http://wiki.tcl.tk/39028.

This FE web page was created 2014 May 09.
(as a backup and alternative to the wiki.tcl.tk page)

This page was changed 2015 Oct 05.
(Small changes.)

Page was changed 2019 Mar 05.
(Added css and javascript to try to handle text-size for smartphones, esp. in portrait orientation.)

Page was changed 2019 Jul 04.
(Specified image widths in percents to size the images according to width of the browser window. Also added some web links.)


NOTE:
The code here MAY BECOME more 'up-to-date' than the code posted on the Tcler's Wiki ---
wiki.tcl-lang.org --- formerly wiki.tcl.tk.