FE 'tkGooies'
'MAPtools' group
Tk GUI script
'tkFetchOSMtiles_atLatLon_ oneTileAtVariousZoomLevels'
FE 'tkGooies''MAPtools' group
Tk GUI script
|
FE Home Page >
FE Downloads Page >
FE 'tkGooies' Description Page >
FE 'tkGooies' 'MAPtools' Page >
This
'tkFetchOSMtiles_atLatLon_ oneTileAtVariousZoomLevels'
Code Page
|
INTRODUCTION to Tcl-Tk script For several years (circa 2014-2016), I had been planning to make various 'map making' Tk GUI's that make
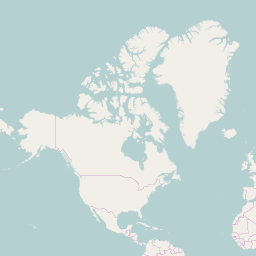
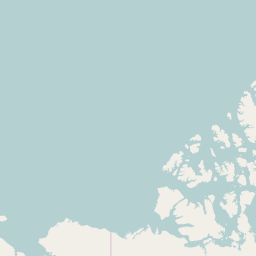
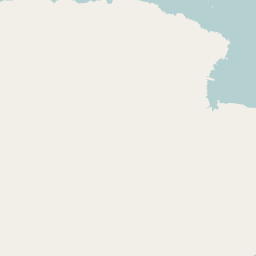
And, eventually, I wanted to provide additional map utility GUI's that allow for reading a 'marker-locations' file and applying markers to a previously created map image (vector-map or tiles-map). On the page 'tkReadOutlineFile_drawOutlineOnCanvas', I presented my first map-making 'tkGooie' script --- to make 'vector' maps from outline-data files in a simple format. Each line of the input outline-file contains a pair of x,y coordinates --- which may be a longitude-latitude pair, in decimal degrees. This 'tkGooie' page is intended to show the first of a set of 'tile-map' utilities. In doing some web searches on building maps like those provided by Google Maps, I ran across an OSM 'slippy map tiles' page, which explains OSM 'zoom-levels', where OSM = Open Street Map. This 'slippy map tiles' page points out that 'tiles' can be retrieved from an OSM server using URL names like http://tile.openstreetmap.org/zoom/x/y.png where 'zoom' represents an integer between 0 and 18 --- and the 'slippy tiles' page provides pseudo-code for how to determine the integers x and y from a given latitude and longitude location. I realized that I could use the 'wget' command (on Linux) to retrieve tiles for specified 'zoom/x/y'. I just needed to make a Tk GUI script that would accept a latitude and longitude (and a zoom level) and do the calculation to determine the integers 'x' and 'y'. Nature of the 'slippy tiles': The OSM 'slippy map tile' page indicates that the tiles at any zoom level cover most of the Earth, but not all of it. The tiles cover from the equator to about 85 degrees North and 85 degrees South in terms of latitude --- but not all the way to the North and South poles, in this 'vertical direction'. The tiles DO cover the Earth 360 degrees in the 'horizontal' direction --- from minus-180-degrees to plus-180-degrees, where 0 degrees is the longitude line through Greenwich, England. Each OSM 'tile' is a 256x256 pixel PNG file.
At OSM zoom-level-zero,
Here is a copy of that tile
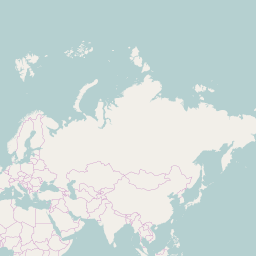
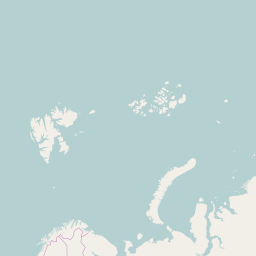
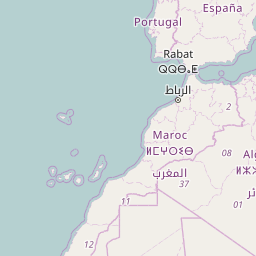
At OSM zoom-level-one,
Here are those 4 tiles
ZOOM-LEVEL-1 TILES
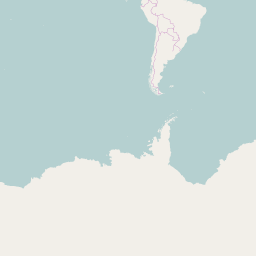
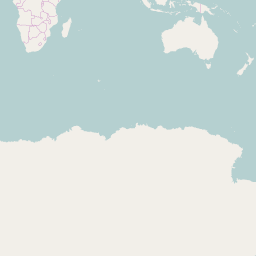
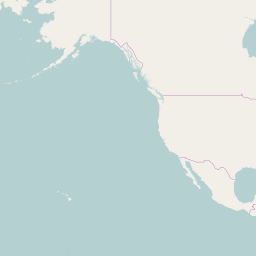
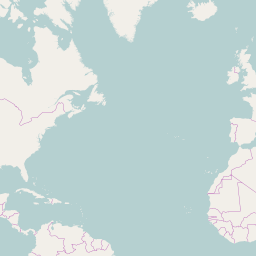
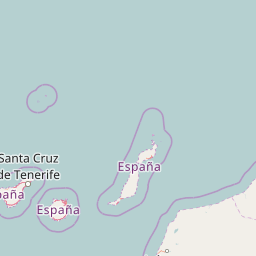
At OSM zoom-level-2, there are
Here are those 16 tiles
ZOOM-LEVEL-2 TILES |
|
You can see the pattern that is emerging here. At each zoom-level, the tiles come from dividing each tile of the previous zoom-level into 4 tiles. And the number of tiles for each zoom level is growing exponentially --- as 2^N x 2^N = 4^N, where N is the zoom-level. In fact, there are more than 68 billion tiles at zoom-level 18 --- and each zoom level goes up a factor of 4 tiles, as the following list indicates.
On some OpenStreetMap servers, there may be a zoom-level-19, but typically level-19 is incomplete. The total number of tiles for zoom levels 0 through 18 can be calculated from the fact that a sum of powers, like Sn = 1 + a + a^2 + a^3 + ... + a^n is given by the formula Sn = (a^(n+1) - 1) / (a - 1). For a = 4 and n = 18, this means that the total of the tile numbers listed above is
(4^19 - 1) / 3 = --- about 91.6 billion tiles. So an OpenStreetMap server may need to be able to store about 91.6 billion tiles that are 256x256 pixels each. The size of the tiles range from about 0.1 kilobyte to about 30 kilobytes --- depending on the variety of colors in the tile. A solid blue tile (an ocean tile) is only about 0.1 kilobyte (KB) in size. A level 16 tile consisting of streets in a downtown area will be about 28 KB. About 2/3 of the tiles are ocean tiles --- only about 0.1 KB each. Let us say the 91 billion tiles, on average, are about 1 KB each (about 1,000 bytes). Then an OSM server might need to store on the order of 91,000 billion bytes. Since a billion bytes is a Gigabyte, an OSM server might need on the order of 91,000 Gigabytes to store the tiles for Earth. That is 91 Terabytes. Since a typical disk drive on a PC nowadays (circa 2018) is a one Terabyte drive, the tiles could probably be stored on about 91 of those PC disk drives. Actually, the OSM people use various techniques to reduce the storage bytes required.
Distances across tiles Perhaps a more useful table (or list) would be one that shows, for each zoom-level, the approximate distance across a tile --- say in kilometers. That can help us (roughly) estimate an appropriate zoom-level to use to fetch tiles for a particular type of map. Since the circumference of the Earth is about 40,050 kilometers (24,870 miles), and there are 360 degrees around the Earth, each degree of longitude around the Earth represents about 40050 km / 360 = 111 kilometers / degree or 24870 miles / 360 = 69 miles / degree The following table indicates the degrees across each tile --- from which we can give an estimate of the width of the tile in number of kilometers (or meters) ... at the equator. (For a tile at 60 degrees latitude, take half of these distance figures for the width of the tile. In other words, use the cosine of the latitude angle as a factor to adjust the width. For heights of the tiles in kilometers or miles at various latitudes, the adjustment calculation is more complex than simply the cosine of an angle.) Reference: The OSM Zoom Levels page.
So, at zoom-level-18, a tile covers an area about the size of a football/fusbol/soccer field or stadium. If you want more information on Open Street Map or 'slippy tiles', you can do a WEB SEARCH on keywords like Let us return to presentation of the code for this 'tkGooie'. A Motivation for this Tk Script:
Briefly: A major motivation for this Tk script is to serve as an aid to using a separate utility that builds a map --- at a particular zoom level --- from an array of tiles (rows and columns of 256x256 pixel PNG files). In that utility, the user can experiment with the number of rows and columns to use to adequately cover the area of interest. The table above (of distances across tiles at various zoom-levels) is often not enough to determine an appropriate zoom level to use for a map. It is often necessary to look at actual tiles, at various zoom levels, at the area of interest (at a latitude-longitude location). The Tk script of this page can help with that. Basic Goals of the Tk Script: My purpose for this Tk GUI script is/was to accept
from the user. For each zoom level (and for the given latitude-longitude), the Tk script will use the OSM algorithm to determine the 'zoom/x/y' integers that specify an OSM tile. Then the script will use the 'wget' command to fetch the several tiles --- and show them in a user-specifiable image viewer. PLANNED LAYOUT OF THE GUI: As I have done with other Tk scripts that I have written in the past year or so, I laid out a 'text image' of the GUI --- to aid me as I coded the frames and widgets. I used the following conventions to make the sketch, with a text editor. |
  SQUARE-BRACKETS indicate a comment (not to be placed on the GUI).
  BRACES          indicate a Tk 'button' widget.
  A COLON         indicates that the text before the colon is on a 'label' widget.
  <---O--->       indicates a Tk 'scale' widget (if any).
  CAPITAL-X       indicates a Tk 'checkbutton' widget (if any).
  CAPITAL-O       indicates a Tk 'radiobutton' widget (if any).
  UNDERSCORES     indicate a Tk 'entry' widget (if any).
|
According to those conventions, I created the following 'text sketch'. |
 FrameNames
 VVVVVVVVVV
             ------------------------------------------------------------------------------------
             Fetch OSM Tiles (256x256 PNG files) - for a Latitude-Longitude - Various Zoom-Levels
             [window title]
             ------------------------------------------------------------------------------------

 .fRbuttons  {Exit} {Help} {SomeLatLonSites} {FetchAndShowTiles} ZoomLevels (0 to 18): 4_8_12_16______

 .fRlatlon   Earth Location in decimal degrees - Latitude: ____________ Longitude: __________

 .fRmsg      [---------- a message line goes here in a label widget -------------------------]
|
From the diagram above, I could see that this GUI will contain about:
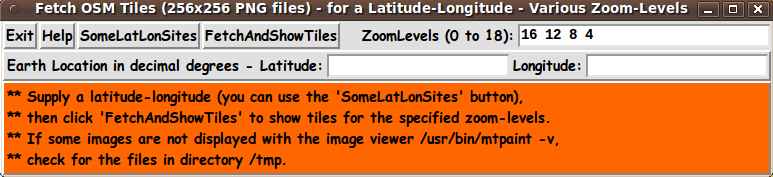
Assembling the pieces (The GUI) Now it was a matter of putting the pieces together. I took 'code-pieces' from one of my other Tk scripts that use 'button' and 'label' and 'entry' widgets. I ended up with the following GUI as an initial display, when the GUI is started up. |
|
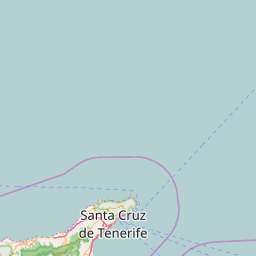
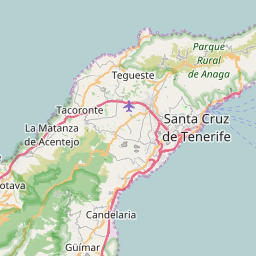
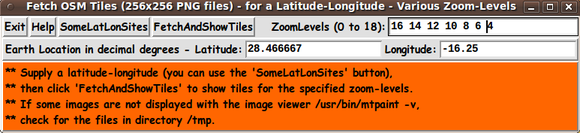
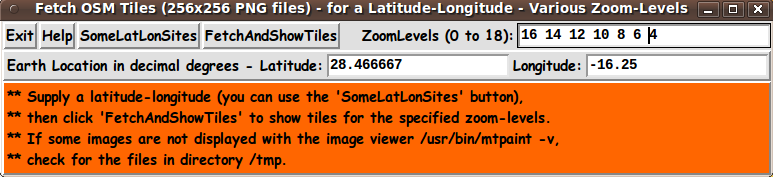
The message area (in red) indicates that the first step for the user is to choose a latitude and longitude to enter. (The user may wish to change some of the zoom-levels in the zoom-level entry field.) For an example, using Wikipedia, I looked up the latitude,longitude location of the capital city of the island of Tenerife in the Canary Islands and found that 'Santa Cruz de Tenerife' is located at Latitude 28.466667, Longitude -16.25 degrees. (I clicked on the coordinates in degrees-minutes-seconds --- on the Wikipedia page --- and was taken to a page that showed the latitude and longitude in decimal-degrees.) |
|
The following list lets you know about how many decimal places you will need in your latitude-longitude specification to accurately 'pinpoint' a location of interest. From data above, at the equator (zero degrees latitude):
(As noted above, at a latitude of 60 degrees, you would need to halve these width distance values.)
As a consequence of these considerations:
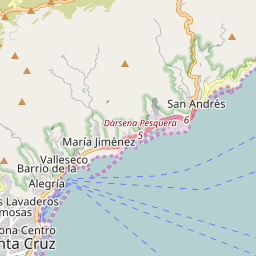
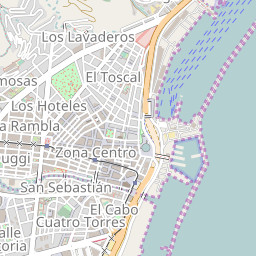
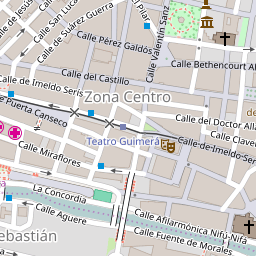
--- After clicking on the 'Fetch' button, within a few seconds, the tiles at zoom-levels '16 14 12 10 8 6 4' starting popping up in an image viewer. The Tk script can use almost any GUI image viewer. (You will find it best to use a 'light-weight', quick-starting viewer --- NOT like the slow-starting GIMP image editor.) You can edit the script to change the 'set IMGviewer' command near the bottom of the Tk script, to use a different viewer. (I ended up using the 'mtpaint' image editor, after trying the 'eog' = 'Eye of Gnome' image viewer. 'mtpaint' is a 'light-weight' image editor that starts up quickly.)
The following tiles were displayed
Since the image viewer I was using puts each window over the previous one that popped up, and I wanted to see the lower/cruder zoom levels on the top of the stack, I ordered the zoom-levels in the zoom-level entry field from largest integer to smallest --- which causes the higher zoom levels to be fetched first. You can change the number and order of the zoom-levels that initially come up in the GUI by editing the 'set ENTRYzoomlevels' statement at the bottom of the Tk script. You can edit the script to change the name of the directory to which the tile (PNG) files are fetched. This Tk script is released with the output directory set to '/tmp' in a 'set DIRtemp' statement near the bottom of the Tk script. Edit that statement if you want to change the target directory. The output filenames are built in the form 'tile_zoom_x_y.png' where 'zoom' and 'x' and 'y' are integers that were calculated by the Tk script to fetch the several tiles. If you do not like those names, you can simply edit the Tk script to change the filename format.
Execution time: It is gratifying that the fetch of the 256x256 pixel 'tile' files, using 'wget', proceeded very quickly --- about half a second per file (or less). This bodes well for the performance of the tile-map making 'tkGooie' that will be published on a separate web page. Even if the user chooses to make a map consisting of about 10 rows and columns of tiles (about 2,560 x 2,560 pixels in a large PNG file), the fetch of the 100 tiles should take on the order of 100 x 0.5 = 50 seconds --- less than a minute. DESCRIPTION OF THE CODE
Below, I provide the Tk script code for this I follow my usual 'canonical' structure for Tk code, for this Tk script: |
  0) Set general window & widget parms (win-name, win-position,
     win-color-scheme, fonts, widget-geometry-parms, win-size-control).

  1a) Define ALL frames (and sub-frames, if any).
  1b) Pack   ALL frames and sub-frames.

  2) Define & pack all widgets in the frames, frame by frame.
              Within each frame, define ALL the widgets.
              Then pack the widgets.

  3) Define keyboard and mouse/touchpad/touch-sensitive-screen action
     BINDINGS, if needed.

  4) Define PROCS, if needed.

  5) Additional GUI initialization (typically with one or more of
     the procs), if needed.
|
This Tk coding structure is discussed in more detail on the page A Canonical Structure for Tk Code --- and variations. This Tk coding structure makes it easy for me to find code sections --- while generating and testing this script, and when looking for code snippets to include in other scripts (code re-use). Experimenting with the GUI As in all my scripts that use the 'pack' geometry manager (which is all of my 100-plus Tk scripts, so far), I provide the four main 'pack' parameters
on all the 'pack' commands for the frames and widgets. I think I have found a good setting of the '-side', '-anchor', '-fill', and '-expand' parameters on the 'pack' commands for the various widgets of this GUI. In particular ... The 'entry' widgets will expand/contract appropriately when the GUI window size is changed --- and button and label widgets stay fixed in size and relative-location as the window size changes. If anyone wants to change the way the GUI configures itself as the main (top-level) window size is changed, they can experiment with the '-side', '-anchor', '-fill', and '-expand' parameters on the 'pack' commands for the various widgets --- to get the widget behavior that they want. --- Additional experimentation: You could change the fonts used for the various GUI widgets. For example, you could change '-weight' from 'bold' to 'normal' --- or '-slant' from 'roman' to 'italic'. Or change font families. In fact, you may NEED to change the font families, because the families I used may not be available on your computer --- and the default font that the 'wish' interpreter chooses may not be very pleasing. Furthermore, there are variables used to set geometry parameters of widgets --- parameters such as border-widths and padding. And you could change the '-relief' values for frames and widgets. Feel free to experiment with those 'appearance' parameters as well. Some features of the code There are plenty of comments in the code to describe what most of the code-sections are doing. See the top of the 'PROCS' section of the script for a list of the procs used in this Tk script. See comments in the procs for details on the purpose of each proc and for details on the methods by which each proc was implemented. Here is a quick overview of the procs --- to give an idea of the 'guts' of this utility: |
  'get_lat_lon'              - called by the 'SomeLatLonSites' button

  'fetch_and_show_tiles'     - called by the 'FetchAndShowTiles' button.

  'z_lat_lon_TO_col_row'     - called by proc 'fetch_and_show_tiles'

  'advise_user'              - called in the 'Additional GUI Initialization'
                               section at the bottom of the script

  'edit_inputs'              - called by the 'fetch_and_show_tiles' proc

  'decimal_check'            - called by the 'edit_inputs' proc

  'popup_msgVarWithScroll'   - called by 'Help' button to show HELPtext var.
|
A fervent hope It is my hope that the copious comments in the code might help Tcl-Tk coding 'newbies' get started in making GUI's like this. Without the comments --- especially in the 'z_lat_lon_TO_col_row' proc and in most of the other procs --- the code might look much more cryptic. Without the comments, potential young Tcler's might be tempted to return to their iPhones and iPads and iPods --- to look for videos of TV 'news' (opinion?) organizations interviewing politicians and their 'surrogates' --- and asking questions of paid 'experts' and 'contributors' --- even though it is quite predictable how they will respond. (How about some man-on-the-street interviews as a refreshing break from the usual propaganda from the usual propagandists?) Isn't it clear that the media outlet is mainly filling time between the commercials that bring in the dough? The dough is the main goal of the media outlet. It is pretty clear that their main goal is NOT shedding more light than heat. In fact, 'more HEAT than light' gets more viewers of the commercials. Potential Tclers: When you get tired of looking at devoid-of-useful-content-TV-interviews with-politicians-and-the-like (sandwiched-between-ridiculous-numbers-of-lengthy-commercial-breaks), try installing-using-changing-enhancing the following Tk GUI script. --- To help out in making scripts like this, here is a page that provides sources of Tcl-Tk code snippets by providing links to various 'tkGooies' scripts that can make it relatively quick work to compose
And when you get to the testing-and-debugging phase in development of a Tk script, here is a page that describes the wonderfulness of the 'wish' 'stack trace' facility --- which can make the testing-and-debugging go relatively quickly and painlessly. The Tk Script CODE Here is a link to CODE for the Tk script 'tkFetchOSMtiles_ atLatLon_ oneTileAtVariousZoomLevels.tk'. With your web browser, you can 'right-click' on this link --- and in the menu that pops up, select an item like 'Save Link Target As ...' --- to save this file to your local computer. Then you can rename the file to remove the '.txt' suffix. Make sure that you have execute permission set on the file --- in order to execute the script. |
|
Some possible FUTURE ENHANCEMENTS There are some enhancements that could be considered for this script, such as:
The bottom line here is that there are almost always enhancements that could be made to (or 'forks' that could be made from) a Tk GUI 'app' like this. One advantage of this Tk script is that it is 'open' code --- available to anyone for enhancement. So if you would like to take a different approach to implementing this script, you are welcome to take this code and build on it (or reconstruct it). IN CONCLUSION As I have said on other code-donation pages on this site ... There's a lot to like about a utility that is 'free freedom' --- that is, no-cost and open-source so that you can modify/enhance/fix it without having to wait for someone else to do it for you (which may be never). A BIG THANK YOU to Ousterhout for starting Tcl-Tk, and a BIG THANK YOU to the Tcl-Tk developers and maintainers who have kept the simply MAH-velous 'wish' interpreter going. |
|
Bottom of this web page that To return to a previously visited web page location, click on the Back button of your web browser a sufficient number of times. OR, use the History-list option of your web browser. OR ...
< Go to Top of Page, above. >Page history:
This page was created 2016 Dec 01.
NOTE: |