FE 'tkGooie' Utilities

'3Dtools' group

3D Examiner for
Parametric Surfaces

given by
3 functions of
2 variables
(u & v)

(FE = Freedom Environment)

'tkGooie' GUI interface for a
3D-examiner of parametric surfaces
given by 3 functions of two variables
---
the 3 functions of $u and $v
are entered into 3 'entry'
fields on the GUI
---
a listbox of sample functions
is provided, by 'nicknames'

FE Home Page > FE Downloads Page >

FE 'tkGooies' Description Page >

FE 'tkGooies' '3Dtools' Page >

This 3D Examiner for Parametric Surfaces Page

INTRODUCTION to a
3D Examiner for Parametric Surfaces given by
3 functions of 2 Variables

On a page of this site titled 'A 3D Examiner for functions of 2 variables' (originally posted at wiki.tcl.tk), I presented code for a Tk GUI that allows for examining surfaces generated over a rectangular grid in the x-y plane --- by determining z from a function f(x,y).

That was nice. In that script, I established a lot of procs that I can use for other 3D viewers.

But the 'generator' part of that script only generates function surfaces above a rectangular domain.

It is not suited to drawing-and-viewing spheres, ellipsoids, toruses, cylinders, and other such surfaces that wrap around on themselves.

These are surfaces that are not 'single-valued' over a set of points in a plane, and they do not 'cover' a rectangular domain.

However, these kinds of surfaces can be generated by 'parametric' functions of the form x=f(u,v), y=g(u,v), z=h(u,v) where u and v can be allowed to vary over a rectangular domain.

So I set about to modify the generator-and-examiner script for surfaces given by f(x,y) so that it could generate and examine parametric surfaces of the kind x=f(u,v), y=g(u,v), z=h(u,v).

I decided to stick with generating quadrilaterals (rather than triangles) --- but over the u,v domain now, instead of the x,y domain.

Using quadrilaterals would make it somewhat easier to re-use some of the code in generating the surface.

One of the biggest changes that I had to make is in the method of drawing the polygons --- in particular, handling the hiding of the quadrilaterals at the back of the view.

In the script for functions f(x,y) generated over a rectangle in the xy plane, I could simply start drawing from the 'far-away' corner of the rectangular grid.

In this case of a rectangular domain in u,v parameter space, however, I could not count on any corner of that rectangle having polygons at the back of the view.

I needed to come up with a polygon sorting routine according to 'z-depth'.

    (Actually, because of the axes I chose relative to the viewing screen, and because of the rotational transformation I chose, I sorted according to 'x-depth'.)

Devising such a polygon-sort routine was just what I needed for some future 3D projects I have in mind.

For example, on my 'bio' page --- titled 'uniquename' --- at wiki.tcl.tk/28584, I have pointed out that I found the 3D model viewing programs of MBS = Mark Stucky ( 3dviewer : A canvas only viewer of 3D data) and GS = Gerard Soohaket ( 3D polyhedra with simple tk canvas) quite inspiring.

I want to devise a similar 3D viewer --- but with enhanced 3D model import options and some other enhancements.

I want to support reading and examining models from ASCII file formats such as Wavefront OBJ, Stereolithography STL, Cyberware PLY, Geomview OFF, and a CAE(FEA)-like file format.

For that project, I will need a polygon sorting routine according to 'z-depth'.

So this project to make a generator-and-examiner for parametric surfaces would be a step in the right direction.


MY GOALS:

I decided to make a similar utility to my z=f(x,y) 3D surface generating and examining utility --- including the following features.

1) ROTATION METHOD:

I would allow the user to specify latitude and longitude angles to specify the view direction.

I would use Tk 'scale' widgets so that setting the 2 view angles can be done quickly and redraw is almost immediate.

I would use '''button1-release bindings''' on the scales to cause the redraw as soon as a scale change is complete.

    (I may eventually add bindings to mouse events on the canvas, like <Motion>, so that the view rotation can be done even more quickly and conveniently.

    This would be similar to rotate/zoom/pan controls that Mark Stucky provided in a 3D model viewer that he published at wiki.tcl.tk titled '3dviewer : A canvas only viewer of 3D data'.)

2) FUNCTION ENTRY:

Instead of having one entry field for the function f(x,y), I would have 3 entry fields --- for functions f(u,v), g(u,v), h(u,v).

And like in my f(x,y) utility, I would have a '''listbox of sample surfaces''' (by name) on the left of the GUI.

Clicking on a line in the listbox puts a set of functions in the 3 entry function fields.

This provides a way of providing some interesting functions that a user can quickly try (and alter), instead of the user spending time trying to think of parametric functions to try.

By using the listbox with scrollbars, an essentially unlimited number of interesting surfaces could be supplied eventually.

3) COLOR CHOICES:

I would (again) allow color choices for the

  • polygon fill
  • polygon outline
  • canvas background

from among 16 million colors, each.

4) DISPLAY OPTIONS:

I would (again) provide 3 radiobuttons by which polygon fill, outline (wireframe display on the canvas background color), or both (fill and outline) can be specified.

5) ZOOM OPTION:

I would (again) provide a 'zoom' Tk scale widget, by which the plot can easily be resized, down or up --- to make sure the entire plot can be seen on the canvas.

Like with the 2 scales for the longitude-latitude view angles, I would use a button1-release binding on the zoom scale to cause the redraw as soon as a scale change is complete.

6) MATH APPROACH:

I would (again) think of the 'fixed, global' coordinate axes oriented as follows:

  • positive z-axis is 'up'
  • positive y-axis is 'to the right'
  • positive x-axis is 'out of the screen'.

Based on that, I would let the 'longitudinal' ('yaw') view angle specify a rotation around the z-axis and the 'latitudinal' ('pitch') view angle specify a rotation around the y-axis.

Then rotations of the surface could be given by an Ry * Rz rotation matrix product.

    (We are avoiding 'roll' --- rotation around the x axis.

    It is too disorienting. 'Roll' is for fighter jet simulations and for emulating a modern cork-screw, turn-me-upside-down roller coaster ride. After all ...

    When we examine an object, like a motorcycle, we walk around it and we may put our eyes somewhat above or below its middle --- but we generally do not stand on our head to examine it.)

In addition to these rotational considerations, I needed to implement a new procedure for sorting the polygons before drawing them.

It appeared that I should be able to use the '-command' option of the Tcl 'lsort' command --- by providing a 'compare' proc to compare 2 given polygon IDs, according to a depth-measure.


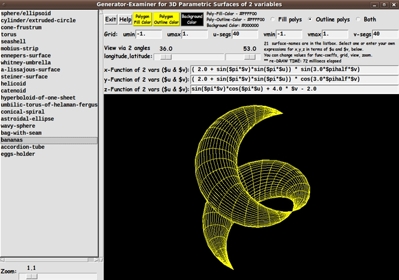
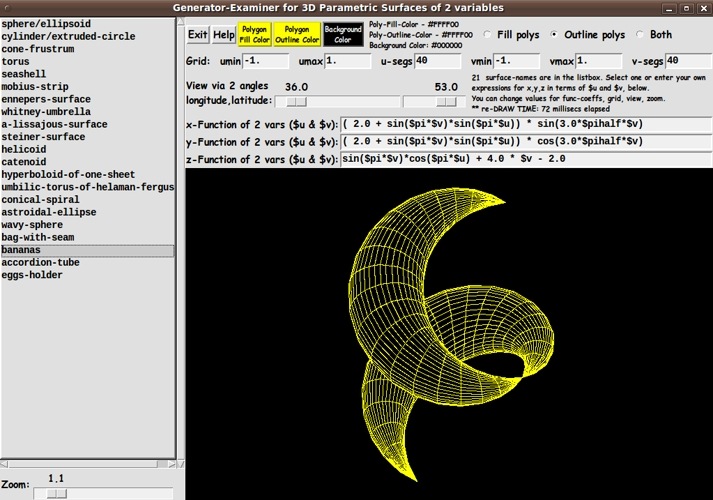
SCREENSHOT of the GUI

In aiming to accomplish these goals, I ended up with the GUI seen in the following image.

In this image, you can see the three buttons for color-setting, across the top of the GUI --- 'Fill', 'Outline', and 'Background'.

To the right of the color-setting buttons, you can see the fill/outline/both radiobuttons, which are used to basically allow for switching between a 'wireframe' display and an opaque-color display.

The next frame down contains the 'Grid' entry fields --- for umin, umax, u-segs, vmin, vmax, and v-segs.

And the next frame contains the 2 scales for the longitude and latitude rotation angles.

And below that frame are the 3 entry fields for the functions f(u,v), g(u,v), and h(u,v) --- to allow for evaluating x,y,z coordinates of points on a surface.

---

Polygon Sort and Image Quality

In addition to these GUI features, the image above indicates that the polygon-sort routine was doing its job quite capably.

'GS' had commented on his wiki.tcl.tk page titled '3D polyhedra with simple tk canvas':

    "The hidden face removal algorithm works well with convex objects but is very limited for the others. See for instance the torus or the shuttle as bad examples."

That indicated to me that a torus might be a stern test of a 'painters-type' algorithm. So I was relieved that a plot of a torus, seen below, turned out looking good.

And the quality of the image held up at various view angles.

---

The 'Help' button on the GUI shows the following text.

The help text describes the various ways in which a 'draw' is triggered.


OPERATION HELP
for this 3D Parametric-Surface
Generation-and-Examination Utility

SELECTING/ENTERING FUNCTIONS:

When the GUI comes up, you can use the listbox to select a parametric-surface to plot, by a 'surface name'.

A MouseButton-1 (MB1) click-release on a 'surface name' will put expressions in variables $u and $v into the 3 x,y,z function entry fields.

The functions will be immediately plotted in the canvas area.

Alternatively, you may enter 3 functions of $u and $v of your own choosing in the 3 'function-entry-fields'.

The main rule to observe is to use '$u' and '$v' to represent u and v.

And, of course, you should compose a syntactically-correct math expression that is to be evaluated at each u,v location on a rectangular grid of u,v coordinates.

'$pi', '$twopi', and '$pihalf' are defined in this utility. You can use those variable names in the expressions when you need the value of pi --- or two times pi --- or half of pi.

---

CHANGING FUNCTIONS
(also called EXPRESSIONS) :

You can change coefficients in a function or change the formulation of the function, in the entry fields.

To re-plot the new function(s), you can press the Enter key when all the entry fields are ready.

OR, to re-plot at any time, you can MB3-click-release on any of the 'function-entry-fields'.

---

ALTERING THE GRID:

You can change the grid parameters --- umin,umax,u-segs, vmin,vmax,v-segs --- by entering new values.

To re-plot based on the new grid, you can press the Enter key in any grid entry field --- or to re-plot at any time, you can MB3-click-release on any of the 'grid-entry-fields'.

Note that the min,max values of u and v can be left at -1.0 and 1.0.

The coefficients of $u and $v in the 3 expressions can be adjusted, instead.

---

CHANGING THE VIEW ANGLE:

You can use the two 'angle-scale' widgets to quickly change either of a couple of rotation angles --- longitude or latitude.

An MB1-release of the slider on a angle-scale widget causes a replot.

You can simply keep clicking in the 'trough' of either scale widget (to the left or right of the scale-button) to step through a series of re-plots, varying an angle one degee per click-release.

Or you can hold MB1 down, when the mouse cursor is to the right or left of the scale-button in the trough, to rapidly but rather precisely change to a new angle of rotation.

Releasing MB1 will cause a re-plot at the new angle.

---

ZOOMING:

You can use the 'zoom-scale' widget to magnify or shrink the plot.

An MB1-release of the slider on the zoom-scale widget causes a replot.

Click-release in the 'trough' --- on either side of the scale's button --- to zoom in/out a little at a time.

---

FILL/OUTLINE/BOTH:

The fill/outline/both radiobuttons allow for showing the plot with the polygons (quadrilaterals) color-filled or not --- and with outlines ('wireframe' mode) or not.

---

COLOR:

Three COLOR BUTTONS on the GUI allow for specifying a color for

  • the interior of the polygons
  • the outline of the polygons
  • the (canvas) background
from among 16 million colors, each.

---

'EVENTS' THAT CAUSE
a 'REDRAW' of the plot:

Press-and-release of the Enter/Return key when focus is in one of the 3 'function-entry-fields'.

Alternatively, a button3-release in a 'function-entry-field'.

Press-release of the Enter/Return key when focus is in the

  • 'umin' entry field
  • 'umax' entry field
  • 'u-segs' entry field
  • 'vmin' entry field
  • 'vmax' entry field
  • 'v-segs' entry field

Alternatively, a button3-release in any of the 'grid-entry-fields'.

Button1-release on the LONGITUDE or LATITUDE scale widget.

Button1-release on the ZOOM scale widget.

Button1-release on the FILL or OUTLINE or BOTH radio-buttons.

Changing color via the FILL or OUTLINE color buttons.

ALSO: Resizing the window changes the size of the canvas, which triggers a redraw of the plot according to the new canvas size.


Overview of the Code

I provide the code for this 3D surface generator-and-examiner Tk script below.

I follow my usual 'canonical' structure for Tk code for this Tk script:


  0) Set general window & widget parms (win-name, win-position,
     win-color-scheme, fonts, widget-geometry-parms, win-size-control,
     text-array-for-labels-etc).

  1a) Define ALL frames (and sub-frames, if any).
  1b) Pack   ALL frames and sub-frames.

  2) Define & pack all widgets in the frames, frame by frame.
     Within each frame, define ALL the widgets. Then pack the widgets.

  3) Define keyboard and mouse/touchpad/touch-sensitive-screen action
     BINDINGS, if needed.

  4) Define PROCS, if needed.

  5) Additional GUI initialization (typically with one or more of
     the procs), if needed.


This structure is discussed in more detail on the page A Canonical Structure for Tk Code --- and variations.

This structure makes it easy for me to find code sections --- while generating and testing a Tk script, and when looking for code snippets to include in other scripts (code re-use).

I call your attention to step-zero. One new thing that I have started doing recently is using a text-array for text in labels, buttons, and other widgets in the GUI. This can make it easier for people to internationalize my scripts. I will be using a text-array like this in most of my scripts in the future.


Experimenting with the GUI

As in all my scripts that use the 'pack' geometry manager (which is all of my 100-plus scripts, so far), I provide the four main pack parameters --- '-side', '-anchor', '-fill', '-expand' --- on all of the 'pack' commands for the frames and widgets.

That helps me when I am initially testing the behavior of a GUI (the various widgets within it) as I resize the main window.

I think that I have used a nice choice of the 'pack' parameters. The labels and buttons and scales stay fixed in size and relative-location as the window is re-sized --- while the 'canvas' expands/contracts as the window is re-sized.

You can experiment with the '-side', '-anchor', '-fill', and '-expand' parameters on the 'pack' commands for the various frames and widgets --- to get the widget behavior that you want.

---

Additional experimentation:

You might want to change the fonts used for the various GUI widgets. For example, you could change '-weight' from 'bold' to 'normal' --- or '-slant' from 'roman' to 'italic'. Or change font families.

In fact, you may NEED to change the font families, because the families I used may not be available on your computer --- and the default font that the 'wish' interpreter chooses may not be very pleasing.

I use variables to set geometry parameters of widgets --- parameters such as border-widths and padding. And I have included the '-relief' parameter on the definitions of frames and widgets.

Feel free to experiment with those 'appearance' parameters as well.

---

Note that the color buttons call on an 'external' color-selector-GUI Tk script to set the colors.

You can make that color-selector script by cutting-and-pasting the code from the page A non-obfuscated color selector GUI on this site.


Some features of the code

There are plenty of comments scattered throughout the code to describe what most of the code-sections are doing.

You can look at the top of the PROCS section of the code to see a list of the procs used in this script, along with brief descriptions of what they do and how they are called.

See comments in the procs for details on the purpose of each proc and for details on the methods by which each proc was implemented.

Here is a quick overview of the procs --- to give an idea of the 'guts' of this utility:


   - 'listboxSelectionTOentryStrings'  - called by a button1-release binding
                                         on the listbox of surface names

   --------------------

   The following 5 procs are called by several procs below - to load the geometry,
   to perform movements of the model geometry, and to draw the polygons.

   - 'load_points_array'
   - 'translate_points_array'
   - 'rotate_points'
   - 'sort_polyIDs_list'
   - 'draw_2D_pixel_polys'

 ---------------------------------

   - 'compare_2polyIDs_by_zdepth'   - called by proc 'sort_polyIDs_list'

   - 'update_status_label'          - shows the draw-time (millsecs) in a label.
                                      Called by proc 'draw_2D_pixel_polys'.

   ---------------------------------

   - 'load-translate-rotate-sort-draw' - a proc that calls 5 procs:
                                           - load_points_array
                                           - translate_points_array
                                           - rotate_points
                                           - sort_polyIDs_list
                                           - draw_2D_pixel_polys

                                       Called by Enter-key and MB3-button1-release
                                       bindings on the 3 (u,v) function entry fields
                                       and on 6 entry fields for u & v min,max,segs.

    - 'rotate-sort-draw'               - a proc that calls 3 procs:
                                           - rotate_points
                                           - sort_polyIDs_list
                                           - draw_2D_pixel_polys

                                       Called by button1-release bindings
                                       on the latitude & longitude 'scale' widgets.

    - 'wrap_draw_2D_pixel_polys'       - a proc that calls 1 proc:
                                           - draw_2D_pixel_polys

                                       Called by button1-release bindings
                                       on the Zoom 'scale' widget and on the
                                       fill/outline/both radiobuttons.
                                       Also called by the 'set_*_color*' procs.

   ---------------------------------

    - 'set_polygon_color1'    - called by the polygon-fill color button.

    - 'set_polygon_color2'    - called by the polygon-outline color button.

    - 'set_background_color'  - called by the background color button.

    - 'update_colors_label'   - called by the 3 'set_*_color*' procs

   ---------------------------------

    - 'popup_msg_var_scroll'  - to show Help text (and perhaps other msgs)


As in my f(x,y) generator-and-examiner script, one interesting feature of this GUI is the way the procs involved in a redraw are broken up into a sequence:

  1. load_points_array
  2. translate_points_array
  3. rotate_points
  4. sort_polyIDs_list
  5. draw_2D_pixel_polys

But in this script, I have added the proc 'sort_polyIDs_list'.

Some 'events' --- such as changing the functions or the uv-grid --- trigger the execution of all 5 procs (in that order), while other events (like longitude or latitude change) trigger the execution of only the last 3 procs.

And some 'simple' changes (like a color change or a switch to wireframe mode) trigger the execution of only the last proc.

Note that I do most of the calculations in 'world coordinates', NOT pixel coordinates.

All the coordinate calculations in the first 4 procs are done in world coordinates.

It is in the 5th proc that I obtain a set of 2D points from a family of 3D points, and I map a 'bounding area' of the 2D points into the current canvas area, in units of pixels --- to finally get the plot, via 'create polygon' commands.

---

To implement the 'sort_polyIDs_list' proc, I needed to provide a 'compare' proc for the '-command' option of the 'lsort' command.

For the details, see the code and comments in the proc named 'compare_2polyIDs_by_zdepth'.


It is my hope that the copious comments in the code will help Tcl-Tk coding 'newbies' get started in making GUI's like this.

Without the comments, potential young Tcler's might be tempted to return to their iPhones and iPads and iPods --- to watch videos of kids hitting their fathers in the mid-section with baseballs or the less-forgiving bat.


The Tcl-Tk SCRIPT CODE

Here is a link to the CODE of the Tk script:
3Dexaminer_forParametricSurfacesOf2vars_ 3DprojectOn2Dcanvas_ RyRz.tk

With your web browser, you can 'right-click' on this link --- and in the menu that pops up, select an item like 'Save Link Target As ...' --- to save this file to your local computer.

Then you can rename the file to remove the '.txt' suffix. Make sure that you have execute permission set on the file --- in order to execute the script.


Besides generating closed surfaces with this utility, you can also use it to generate the same surfaces as the f(x,y) utility did.

In that utility, you entered a single function with variables $x and $y, to provide the z values.

You can enter those same functions in this utility --- just use the following 3 expressions to provide x, y, and z:

  • u
  • v
  • f(u,v)

The image below provides an example.

Note the '$u' and '$v' in the first 2 of the 3 function entry fields.

The main difference between doing a plot of that surface with this Tk script and the f(x,y) Tk script is the algorithm used to choose the 'painting-order' of the polygons.

---

And the following image shows that you can 'go bananas' with this utility.

FILL ONLY

When the user chooses the 'fill-only' (no outlines) radiobutton, the plot would look like a blob of solid color, if all the polygons were painted the same fill color.

You can emulate this by setting both the outline color and the fill color to the same color and using the 'both' radiobutton.

To avoid this color-blob, the 'draw_2D_pixel_polys' proc provides gradation of the fill color of polygons according to the average (original) z-height of each polygon.

The 'eggs-holder' surface plot above is an example of the shaded result.

This is a somewhat 'expensive' operation.

The draw times go up a factor of at least 50% --- over the use of the 'outline' or 'both' radiobutton options, which do not shade the polygons.

    (Note:
    The color assignment according to z-height can no doubt be improved. This was just a first attempt.

    If it turns out that the 'format' command is eating up most of the time, I can probably get a big improvement by using an index into a table of about 20 colors, instead of using 'format'.

    Also, I can get some improvement during rotation of the model by computing the average-z-height (of 4-vertices) of the polygons just one time, in the 'load_points_array' proc, for a given function and grid --- and storing the averages in an array for repeated use, for example, during rotations.

    In other words, one can probably gain some speed at the cost of some memory.

    I may return to this issue someday and provide a significantly faster z-height-color-assignment routine --- or some other polygon-shading method.)


THE MILLISECONDS DISPLAY

Like in the f(x,y) version of this utility, this script displays the milliseconds elapsed to do each redraw --- to help get an idea of whether the 'model' (data-surface or data-cloud) can be rotated smoothly via mouse motions on the canvas.

The milliseconds are displayed in the label widget to the right of the longitude-latitude scale widgets.

If we can do redraws in about 50 milliseconds (corresponding to a 'frame rate' of 20 frames per second), we should be able to rotate the data cloud rather smoothly.

Unfortunately, for this u,v-parametric-surface utility, it turns out that a 40x40 data grid was re-drawing (for a rotation angle change) at around 300 milliseconds on my computer --- whereas redraws of a similar sized grid typically occurred in about 70 milliseconds for the f(x,y) version of this utility.

Not surprisingly, an 80x80 data grid was taking about 3 to 4 times as long for a re-draw --- around one second.

I have not taken the time yet to investigate in which of the 5 redraw procs most of the time is being spent.

Perhaps other Tclers can help in this regard. At this time (in 2013), I do not know the internals of Tcl-Tk well enough to spot areas where significant gains can be made.

No doubt, there are some ways to change the calculations and/or procedures to get a significant speed up of the redraws and thus allow for smooth rotation of large grids.

If this script is changed to allow for 'immediate' rotation according to mouse motion on the canvas, then the rotation will definitely be a bit 'jumpy' --- even for 'small' grids on the order of 30x30.

So it behooves one to find ways to speed up the draw procs.


SCALES ('SLIDERS') RESPONSE

'-repeatdelay 500' and '-repeatinterval 50' parameters are present on all three 'scale' widgets.

If the responsiveness of the sliderbar movements is not to your liking (when you press-and-hold mouse-button-1 over a scale's trough --- to rapidly make changes of about 5 to 10 degrees in a view angle), you can change these milliseconds values.


MORE SURFACES

I intially provided about 20 function-triplets via the surface-names listbox.

I could add some sombrero-like surfaces, from the f(x,y) utility, by providing the 3 u,v functions: $u, $v, f($u,$v) --- where f($u,$v) is the sombrero function f($x,$y) but with $x and $y replaced by $u and $v.

And you can do like I did --- do an internet search on terms like parametric surface 3d --- to find more examples to add.


SOME POTENTIAL ENHANCEMENTS:

Eventually some other features may be added to this utility :

  • The ability to PAN the plot, as well as rotate and zoom it.

  • The ability to use mouse motions on the canvas to rotate, zoom, and pan the plot.

    For example:
    MB1 to rotate, MB2 to zoom, and MB3 to pan the surface plot.

  • More options to vary the color of the filled polygons may be added --- say, by allowing the user to choose the color of each polygon according to the original 'x-height' or 'y-height' --- in addition to the current default of varying the polygon 'fill-only' colors according to the original 'z height'.

  • More polygon-color assignment options may be added --- so that the user can have colors added to polygon vertices or polygons --- to 'liven up' the surface plot.

    For example, options to assign random RGB colors or a rainbow of colors (chosen from a table of colors) to the faces (or points) may be added.

    For example, displays like the following could be rendered.

  • An option to 'shadow color' the polygons may be added --- to change the color of the polygon faces according to the angle that they make with a light source.

      (Initially we may assume that the light source is coming from the viewer.

      But eventually we may add the ability to specify a different, arbitrary direction of the light source.)

  • Depth clipping may be added --- so that the user can essentially get section views of the surface.

  • A 'triad' may be added to show the orientation of the xyz axes of the model in any (re)plot.

  • A check-button may be added to allow for switching to a 'perspective' view, from the current 'parallel projection'.

  • A check-button may be added to allow for 'backface culling', to speed up the plots when lots of polygons are not facing the viewer and perhaps would be hidden --- for example, polygons on the back-side of a sphere or torus or cylinder.

  • Sorting according to a different 'z-depth' measure of the polygons could be offered --- to allow for (perhaps?) better showing/hiding of near and far polygons.

  • More elaborate shading techniques may eventually be implemented --- like Gouraud --- to get smoother shading effects across polygon edges, and perhaps to get glossy effects.

      (These shading effects may be easiest to implement by using colors assigned to polygon vertex points rather than colors assigned to polygons.)

    I would be inclined to try a 'barymetric' technique to shade triangles, like the technique that I used in the 'wheeeMorph' 'tkGooie' utility in the 'IMAGEtools' group.

    This (color shading across individual polygons) would really slow each plot down, but having the option might be worth it, to get a higher quality image --- if it can be done within 10 to 30 seconds for a 40x40 grid.

      (Unfortunately, there is no Gouraud option built into the Tk 'create polygon' command for the canvas.

      I would like to suggest this for Tk 9.0 --- at least in the case when the polygons are triangles --- allow for specifying a different color at each of the 3 vertices.)

  • More surface nick-names (and corresponding function triplets) may be added to the listbox.

I may add a few more ideas for enhancements to this script in coming months (or years), as I tackle other 3D utilities.


NEXT 3D PROJECTS

The development of the polygon-depth-sort proc for this script will be very useful to me.

That proc, and the other procs in this script, will be useful for other 3D Tk-script projects --- such as generation-and-viewing of terrain surfaces and reading-and-examining 3D model files.

However, I will need to make some changes to handle triangular polygons --- and polygons of essentially any number of sides --- instead of 'only quads'.


SIMILAR SOFTWARE

I ran across an image of the 'SurfX3D' GUI that is very similar to the GUI of the script presented on this page.

You can see that this GUI allows for 'pre-setting' some parameters via expressions so that those expressions do not have to be calculated repeatedly in the surface calculation loops.

I may add a feature like that someday to this Tk script.

You can see near the bottom of the GUI that it provides entry fields for a couple of viewing angles called 'Z rotate' and 'XY Tilt' --- apparently analogous to the 'longitude' and 'latitude' angles, respectively, of this Tk GUI.

It is not clear if you can change viewing angle as quickly with SurfX3D as you can with this Tk GUI.

Similarly, there is an entry field for 'Overall Scale %' --- apparently analogous to the 'zoom' scale-widget option of this Tk GUI.

It is not clear if you can change 'scale %' as quickly with SurfX3D as you can with this Tk GUI.

But one thing is for sure. You can check this Tk GUI code to make sure there is not 'ad-ware', 'spy-ware', or other 'bloat-ware' in this code.

Nicely, SurfX3D is freeware (circa 2013) --- and so is this script.

The bang-per-buck ratio of this free software is infinity.

Combine that with open source (i.e. the ability to modify, enhance, and fix the Tk script) and you have programmer's heaven. (Sounds like the name of a web site that I have seen.)

In other words, YOU can add more bang for still-zero bucks and you get a larger infinity --- from the new, bigger-numerator-over-zero bang-per-buck ratio.

To infinity and beyond! Thank you, Tcl-Tk.

Bottom of this page for a
3D Examiner for Parametric Surfaces
given by 3 functions of 2 variables
--- a utility in the FE 'tkGooies' system,
in the '3Dtools' group.

To return to a previously visited web page location, click on the Back button of your web browser a sufficient number of times. OR, use the History-list option of your web browser.
OR ...

< Go to Top of Page, above. >

Page history:

The first releasable version of the code was posted 2013 Jan 02 at http://wiki.tcl.tk/37524.

This FE web page was created 2014 May 04 --- as a backup and alternative to the wiki.tc.tk page (and site).

This page was changed 2016 Jan 01.
(Added more links and some paragraphs.)

Page was changed 2019 Feb 23.
(Added css and javascript to try to handle text-size for smartphones, esp. in portrait orientation.)

Page was changed 2019 Jun 12.
(Specified image widths in percents to size the images according to width of the browser window.)


NOTE:
The code here MAY become more 'up-to-date' than the code posted on the Tcler's Wiki --- wiki.tcl-lang.org --- formerly wiki.tcl.tk.