FE 'tkGooie' Utilities

'3Dtools' group

a 3D Model Examiner
that reads 3D model files

(FE = Freedom Environment)

'tkGooie' GUI interface for a
3D model examiner that reads
ASCII 3D model files, such as
Wavefront OBJ files

FE Home Page > FE Downloads Page >

FE 'tkGooies' Description Page >

FE 'tkGooies' '3Dtools' Page >

This 3D Model File Examiner Utility Page

INTRODUCTION to a
3D Model Examiner that reads 3D model files

On a web page (of this FE site) that provides code for a '3D Examiner for functions of 2 variables', I pointed out that I found a couple of 3D model viewing Tcl-Tk scripts quite inspiring --- two scripts of 'MBS' (Mark Stucky) and 'GS' (Gerard Soohaket) that they provided at wiki.tcl.tk --- under the titles

I stated my plan to devise a similar 3D viewer --- but with enhanced 3D model import options and some other enhancements.

My plan was to support reading and examining models from ASCII file formats such as

  • Wavefront OBJ
  • Stereolithography STL
  • Cyberware PLY
  • Geomview OFF, and
  • eventually, at least one CAE(FEA) file format.

Thus, an unlimited number of 3D models could be viewed.

I took steps toward those ends by first developing two somewhat less ambitious 3D surface viewers:

whose code is presented on this site via the 'tkGooies' '3Dtools' page which also presents this page.

For the first of these 3D surface viewers, I presented code for a Tk GUI that allows for examining surfaces generated over a rectangular grid in the x-y plane --- by generating the z-values of points on the surface, over a rectangular grid, from a function of x and y --- z=f(x,y).

In that script, I established a lot of procs that I could use for other 3D viewers. In particular, I provided a proc to rotate '3D point clouds'.

In the second of these 2 pages/scripts, I devised a proc for polygon-sorting according to a 'z-depth'.

So those two 3D viewer projects provided a lot of the code that I would need to make the 3D model-file viewer that was my ultimate goal.

In both of those projects, I was plotting only 4-sided polygons (quadrilaterals) on the Tk canvas.

Some of the new items that I would need were:

  • data-loader procs for ASCII 3D model files --- in particular, for OBJ, PLY, OFF, and STL files

and
  • enhanced 'sort' and 'draw' procs that would handle N-gons for N=2,3,4,5,6,7,8,9,10,... --- not just N=4.


MY GOALS:

I decided to make a 3D model file reading-and-viewing utility that included the following features.

1) Rotation method:

I would allow the user to specify latitude and longitude angles to specify the view direction.

I would use Tk 'scale' widgets so that setting the 2 view angles can be done quickly and redraw is initiated immediately.

I would use button1-release bindings on the scales to cause the redraw as soon as a scale change is complete.

    I may eventually add bindings to mouse events on the canvas, like <Motion>, so that the view rotation can be done even more quickly and conveniently.

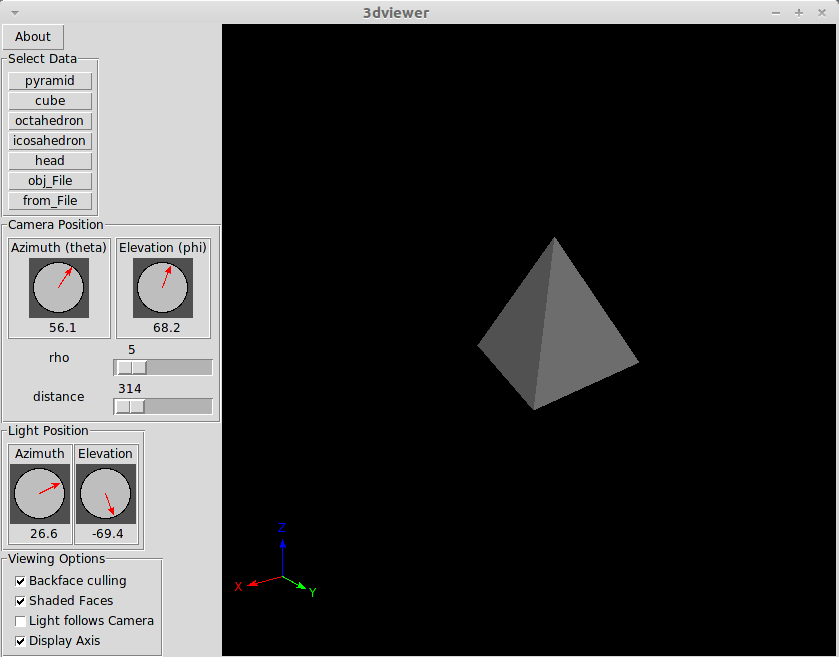
    This would be similar to rotate/zoom/pan controls that Mark Stucky provided in a 3D model viewer that he published at wiki.tcl.tk/15032, under the title '3dviewer : A canvas only viewer of 3D data'.

2) Data entry:

Instead of having one entry field for the function f(x,y) --- or 3 entry fields for functions f(u,v), g(u,v), h(u,v), for the parametric function viewer --- I would have an entry field for a 3D model filename --- along with a 'Browse...' button by which to navigate to and select a file in the computer's directory structure.

'Data-loader' procs for the Wavefront OBJ, Cyberware PLY, Geomview OFF, and Stereolithography ASCII 3D file formats would be provided.

Thus we have the ability to choose from an unlimited variety of 3D models.

3) Color choices:

Like in the f(x,y) viewer and the f(u,v),g(u,v),h(u,v) viewer, I would allow color choices for

  • polygon fill
  • polygon outline
  • canvas background
from among 16 million colors, each.
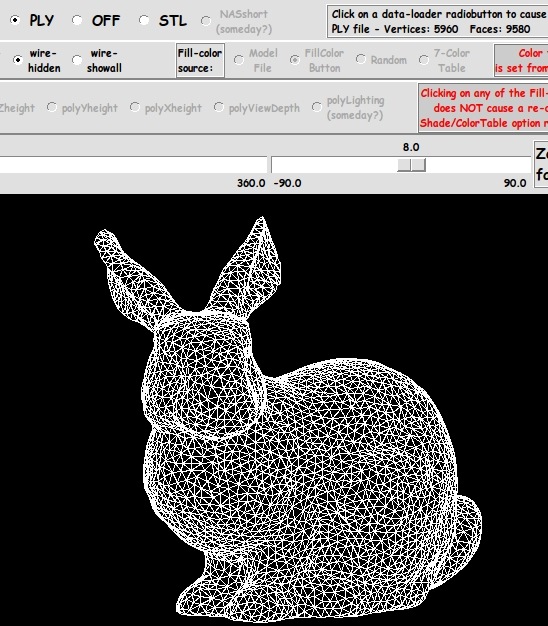
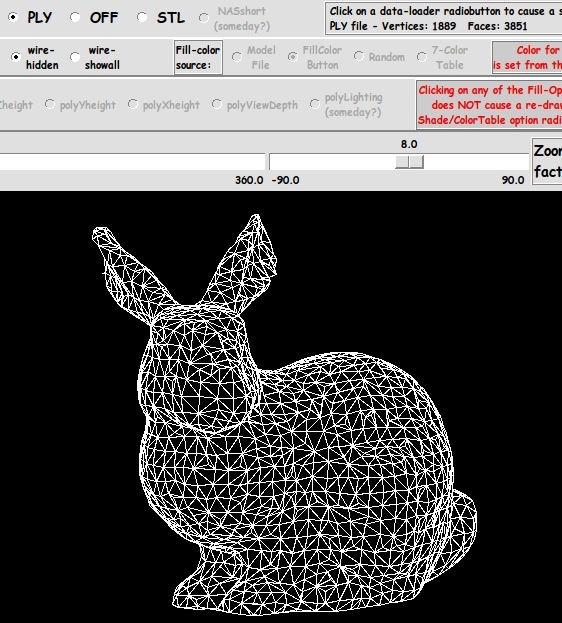
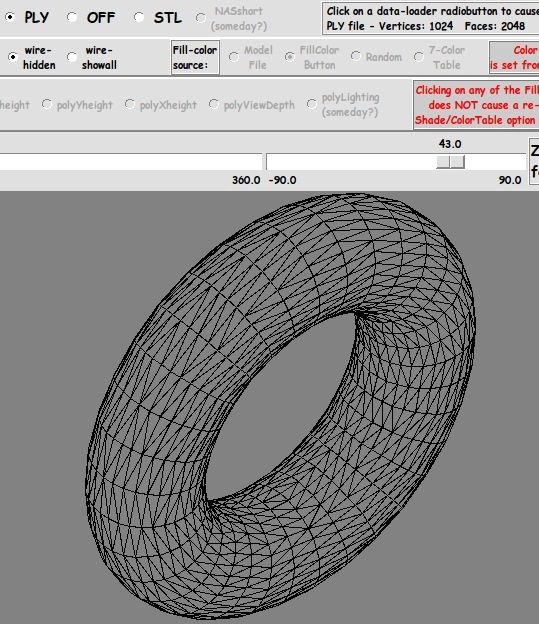
4) Display options:

I would provide radiobuttons by which the type of model display could be chosen:

  • 'fill-only' of polygons
  • 'fill-and-outline' of polygons

and two 'outline-only' options:

  • 'wireframe-hidden'
  • 'wireframe-show-all'.

5) Zoom option:

Like in the f(x,y) viewer and the f(u,v),g(u,v),h(u,v) viewer, I would provide a 'zoom' Tk scale widget, by which the plot can easily be resized, down or up --- to make sure the entire plot can be seen on the canvas.

Like with the 2 scales for the longitude-latitude view angles, I would use a button1-release binding on the zoom scale to cause the redraw to be initiated as soon as a scale change is complete.

6) Math approach:

Whereas in the two surface plotting Tk scripts, I used a z-axis in the 'up' direction, for this model-file viewer I would think of the 'fixed, viewing' coordinate axes oriented as follows:

  • positive y-axis is 'up' (parallel to the monitor screen)

  • positive x-axis is 'to the right' (parallel to the monitor screen)

  • positive z-axis is 'out of the screen' (perpendicular to the monitor screen).

Based on that, I would let the 'longitudinal' ('yaw') view angle specify a rotation around the y-viewing-axis and the 'latitudinal' ('pitch') view angle specify a rotation around the x-viewing-axis.

Then rotations of the models could be given by an Rx * Ry rotation matrix product.

    (We are avoiding 'roll' --- rotation around the z axis. It is too disorienting. 'Roll' is for fighter jet simulations and for emulating a snowboarder doing flips off a half-pipe or a snow-park ramp. After all ...

    When we examine an object, like a (stuffed) tiger, we walk around it and we may put our eyes somewhat above or below its middle --- but we generally do not stand on our head to examine it.)

As I did for the viewer of parametric surfaces given by 3 functions of u and v, I needed to implement a procedure for sorting the polygons before drawing them.

I could take the sorting utility for that parametric surface viewer and enhance it to handle N-gons, where N = 2,3,4,... --- not just 4-gons (quadrilaterals).

Again, I would use the '-command' option of the Tcl 'lsort' command --- by providing a 'compare' proc to compare 2 given polygon IDs, according to a depth-measure.

---

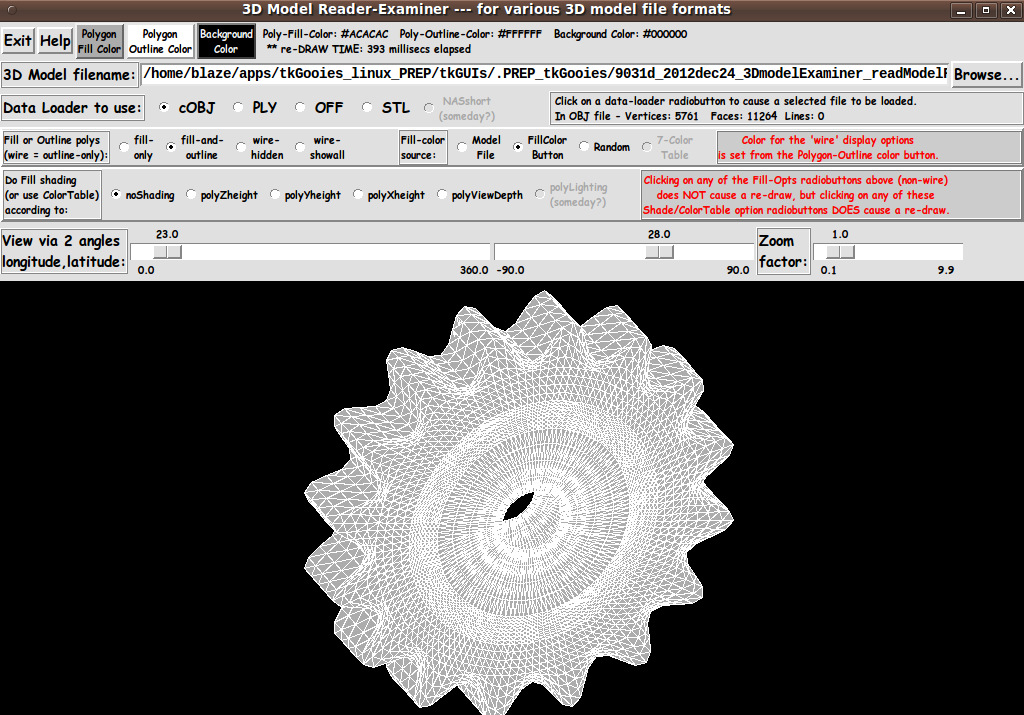
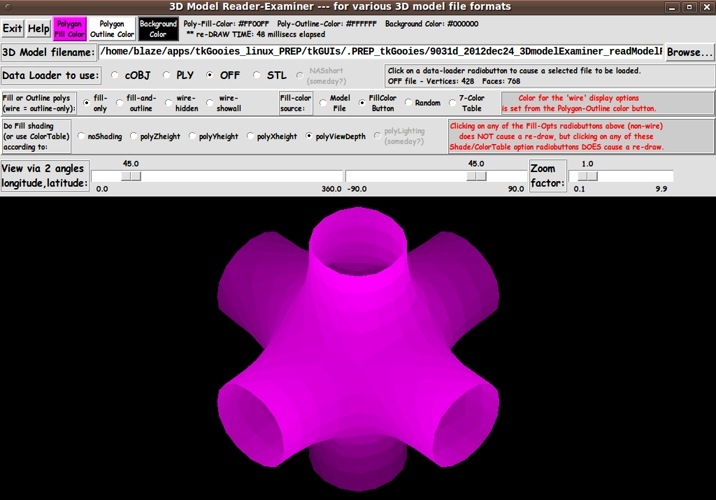
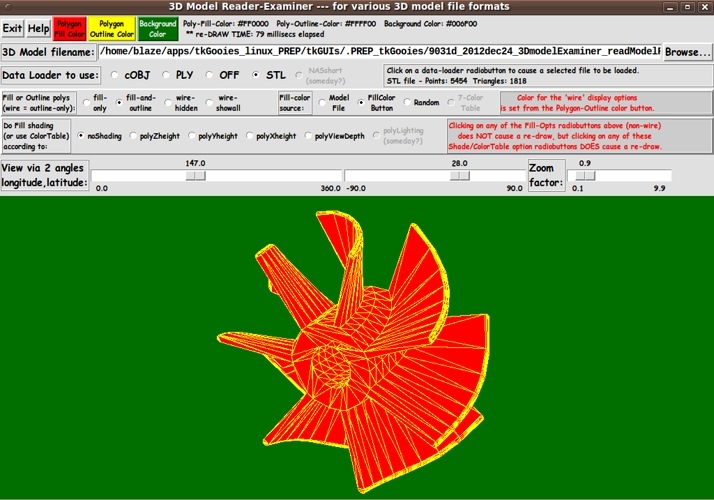
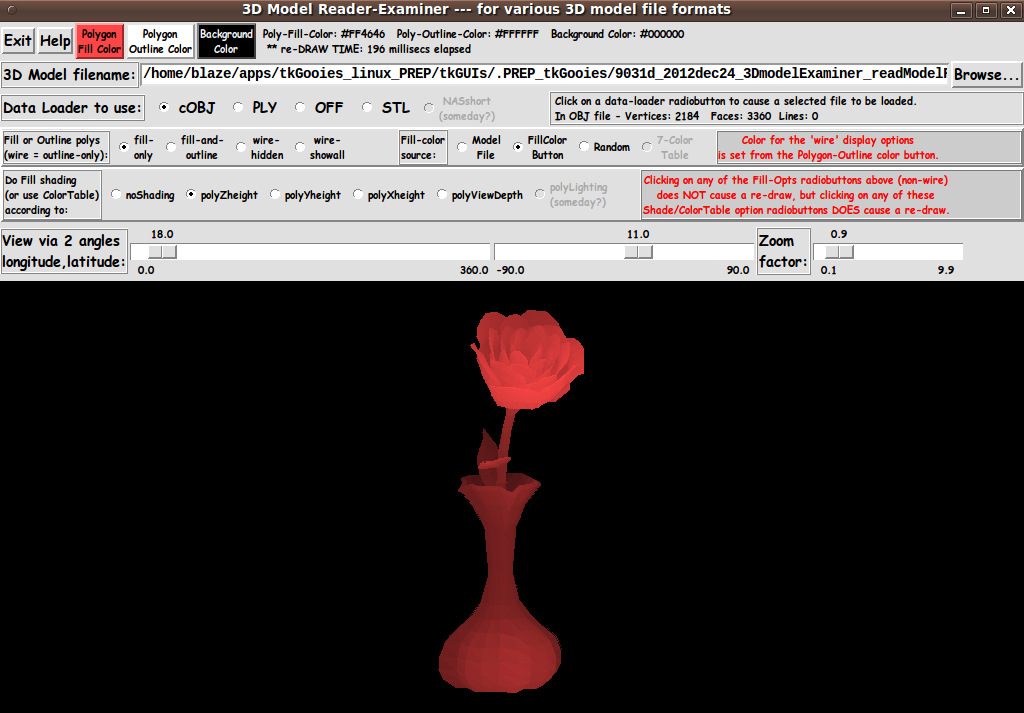
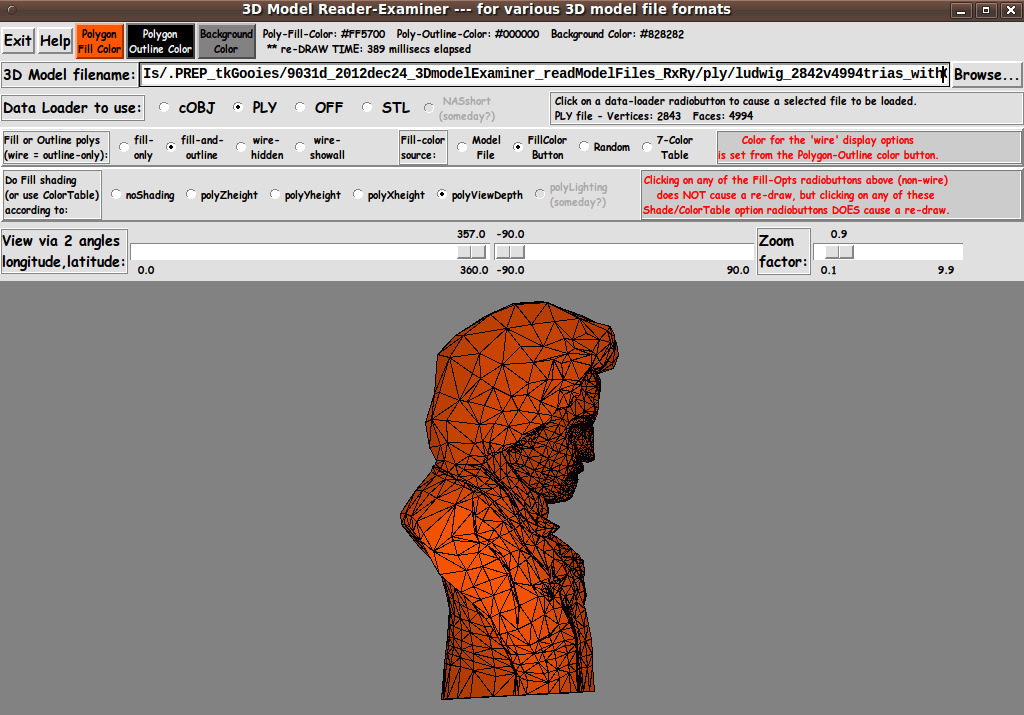
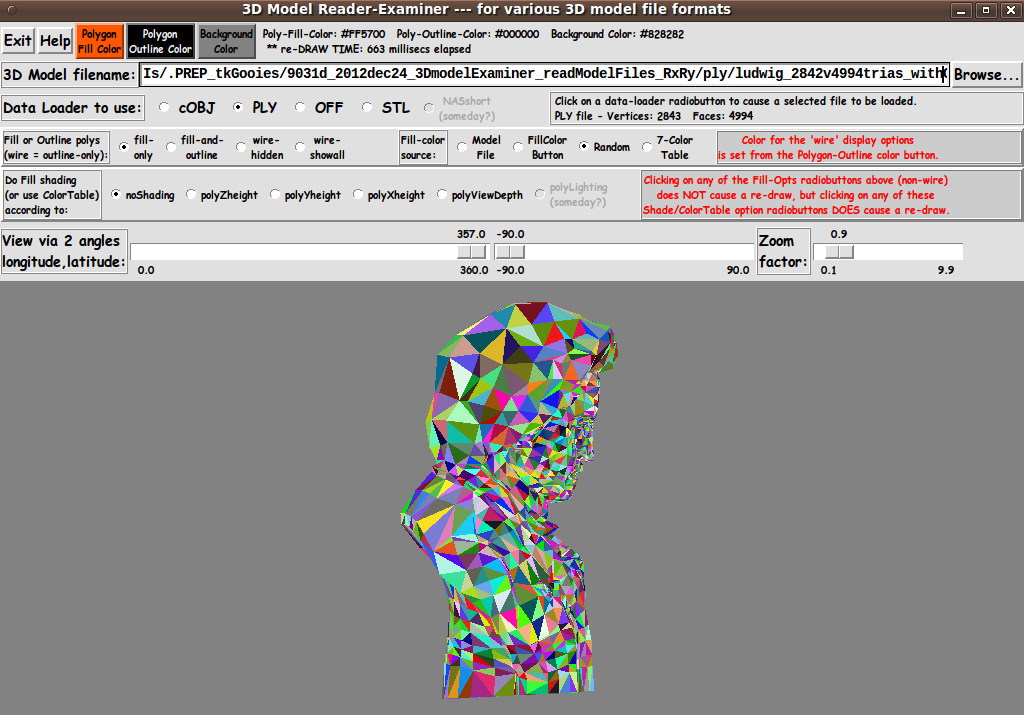
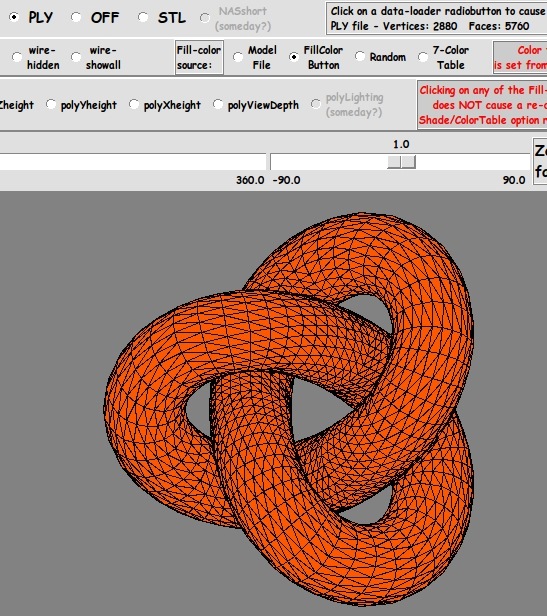
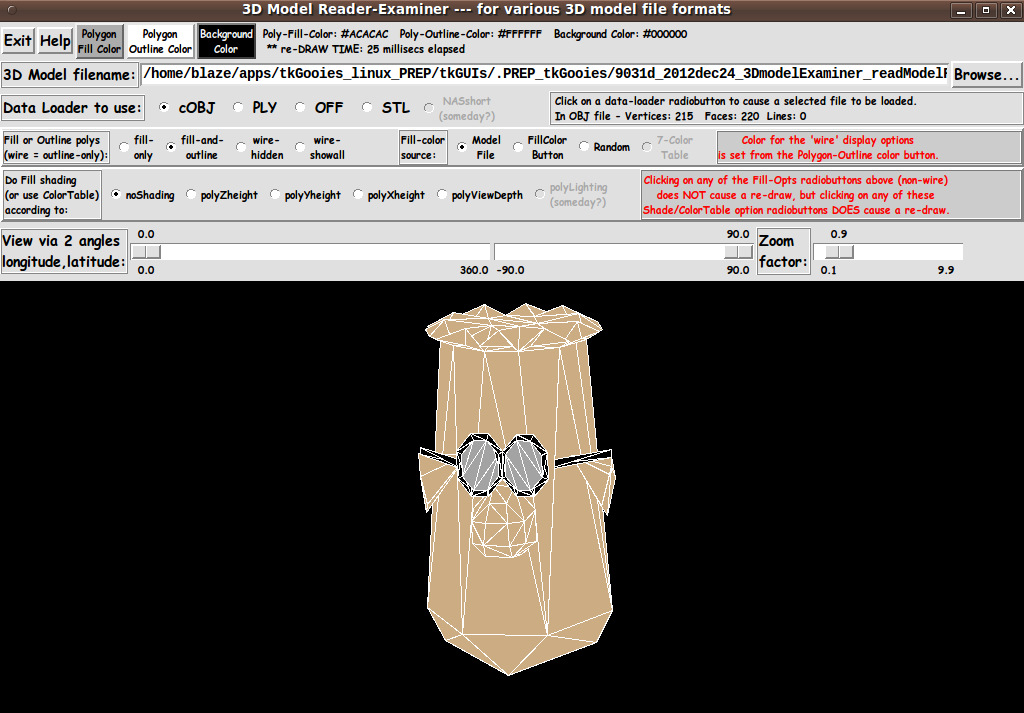
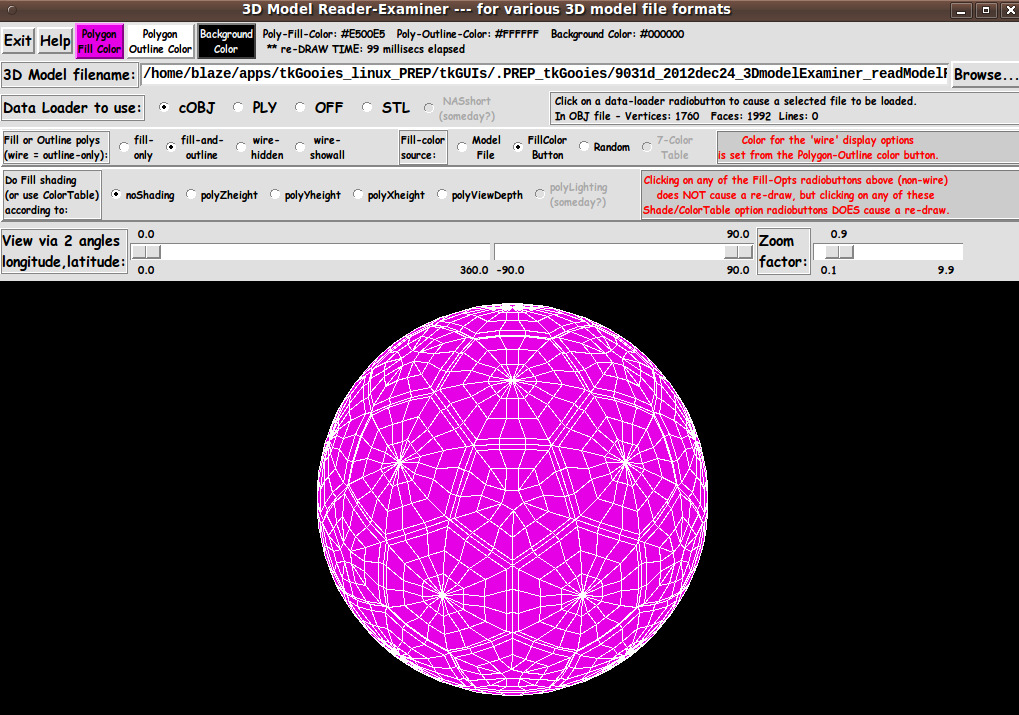
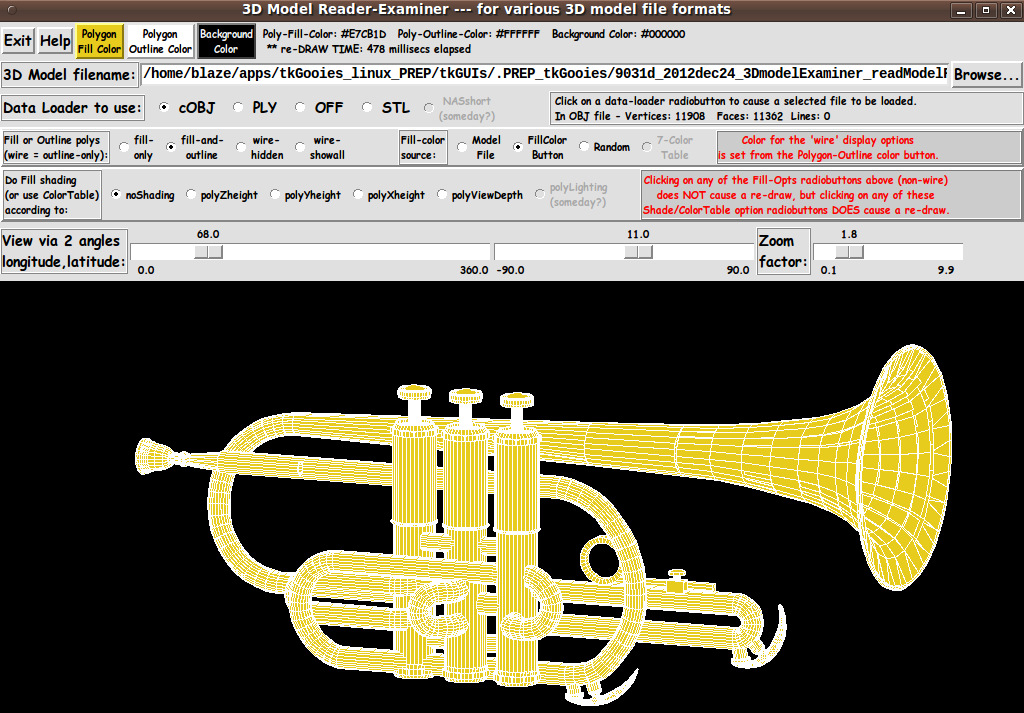
In aiming to accomplish these goals, I ended up with the GUI seen in the following image.

In this image, you can see the three buttons for color-setting, across the top of the GUI --- 'Fill', 'Outline', and 'Background'.

In the frame below the color-buttons frame, you can see the entry field for a 3D model filename --- along with a 'Browse...' button.

Below that frame, you can see the frame for radiobuttons by which the user can choose the 'data-loader' to use --- OBJ, PLY, OFF, STL, or whatever.

Below that frame, you can see the frame for

  • fill/outline radiobuttons

  • fill-color-source radiobuttons

And below that frame is the frame containing some 'shading' options, for shading the polygon fill color(s) based on height measures along the 'local', 'model' coordinate axes (z or y or x) or a z-depth measure along the viewing direction (the z-axis of the fixed, 'viewing' coordinate system).

And the next frame contains the 2 scales for the longitude (yaw) and latitude (pitch) rotation angles --- around the fixed, 'viewing' axes --- the y-axis and the x-axis, respectively.

Also in that frame is the scale for zooming the model, in or out.

---

In addition to these GUI features, the image above indicates that the polygon-sort routine does its job quite capably --- at least for models that are nicely meshed, with lots of polygons of approximately the same size (and no long 'slivers').

In fact, the polygons (triangles) are nicely hidden in the classic 'cow' and 'bunny' models that are available from large model sites at Stanford and Georgia Tech --- as seen in the following images.


11,264 faces and a draw-time of about one second.


69,451 faces and a draw-time of about 14 seconds.

The 'gear' model above contained 11,264 faces and was loaded-translated-rotated-sorted-and-drawn in about one second.

This 'bunny' model contained 69,451 faces --- what seems like a superfluous number of triangular faces --- and was drawn in about 14 seconds.

That is not as speedy as a viewer using OpenGL (and firmware in a graphics card to handle the 'graphics pipeline') would draw this bunny.

But the draw speed is not too shabby for free software --- and considering the large number of polygons --- and, if you simply want to examine the model, not make it spin like a top.

I was pleasantly surprised that I could view models with tens of thousands of polygons in a reasonable amount of time.

And I was able to find 'decimated' bunny models --- models with reduced numbers of polygons --- as seen in the following images.


16,301 faces and a draw-time of about 3.0 seconds.


9,580 faces and a draw-time of about 1.8 seconds.


3,851 faces and a draw-time of about 0.6 second.

To show that OBJ and PLY and OFF and STL files can be handled by this utility, note that the 'gear' and 'cow' models above were from OBJ files, the 'bunny' files were from PLY files, and here are a couple of models from OFF and STL files.

This OFF model of intersecting pipes contained 768 faces.

This STL model of turbine blades contained 1,818 triangles.


During development and testing of the 'data-loader' procs of this utility, I read in about 80 different OBJ files, about 50 different PLY files, about 20 different OFF files, and about 5 different STL files.

I have confidence that I can read in most of the ASCII OBJ, PLY, OFF and STL files that one would run across --- and if I/you hit any glitches, the source code is available.

You can enhance these 'data-loaders' as needed.

    NOTE:
    These data-loaders do not handle the full range of capabilities of these several 3D model types.

    For example, the OBJ file Data Loader will handle 'one-object' OBJ files. It will not handle 'sub-models' (separated objects) within OBJ files.

    Nor will these Data Loaders handle 'special features' such as 'texture mapping' or 'surface normal' data.

    These Data Loaders read the basic geometry data --- the 'vertex' records and the 'face' (connectivity) records.

---

The 'Help' button on the GUI shows the following text.

It describes the various ways in which a 'draw' is triggered.


HELP for this 3D-Model-Examiner Utility

When the GUI comes up, you can use the 'Browse...' button to find a 3D model file to load.

Then set a radiobutton for the appropriate 'data-loader' to use.

An MB1-click-release on any of the 'data-loader' radiobuttons causes 3D model data in the specified filename to be loaded into 'in-memory arrays'. (MB = Mouse Button)

The selected 'data-loader' will read the file's 3D model data --- data for points and polygons (and line-segments, if any).

Typically, the polygons in 3D model files are triangles and/or quadrilaterals (N-gons where N is 3 or 4), but these data-loaders will also load data for 2-gons (line-segments) and N-gons where N is greater than 4.

Once the model data is loaded, you can use the two rotation angle 'SCALE' (slider) widgets, to quickly change either a 'longitude' (yaw) angle or a 'latitude' (pitch) angle.

These two scales allow for 'semi-dynamically' rotating the 3D-model by moving the sliders of the 2 scale widgets.

Three types of slider-button moves of the angle 'scale' widgets and the results:

1) 'Grab' the slider button (by clicking on it with MB1 and holding) and then drag MB1. RESULT:
When MB1 is released, the angle at that point on the scale is used to rotate the model.

OR

2) MB1-click-release repeatedly on the TROUGH of the scale (to the RIGHT or LEFT of the slider button).

RESULT: The model is rotated 1 degree per click-release.

OR

3) Click on the TROUGH of the scale (to the RIGHT or LEFT of the slider button) with MB1 and hold down while the slider button moves, then release MB1.

RESULT:
When MB1 is released, the angle at that point on the scale is used to rotate the model.

---

There are several types of radiobuttons to control the type of display of the 3D model:

FILL/OUTLINE of polygons:

    1) fill-only

    2) fill-and-outline

    3) wire-hidden (i.e. outline-only, with hidden outlines)

    4) wire-show-all (i.e. outline-only, none hidden)

FILL-COLOR SOURCE of polygons:

    1) Polygon-Fill color button (applied to all polygons)

    2) Model file color data (can be different for each polygon or for groups of polygons)

    3) random colors (for each polygon)

    4) colors from a color-table (distributed over the polygons according to a user-specified setting of radiobuttons that indicate a color-distribution direction)

Type of SHADING of polygons:

    1) by depth, along the 'original' z-axis of the model

    2) by depth, along the 'original' y-axis of the model

    3) by depth, along the 'original' x-axis of the model

    4) by angle of polygon normals relative to a lighting direction

Clicking on 'wire-hidden' or 'wire-show-all' causes immediate display of a 'wire-frame' image of the model --- using the setting of the 'Polygon Outline' color button as the color of the lines.

When either of the 2 'wire' FILL/OUTLINE options are chosen, the radiobuttons for FILL-COLOR-SOURCE and SHADING are disabled, i.e. 'grayed-out'.

When either of the 2 'fill' FILL/OUTLINE options are chosen, the FILL-COLOR-SOURCE options are activated --- and the SHADING options may be activated according to user-selection of a FILL-COLOR-SOURCE option.

Some information on supported records of OBJ, PLY, OFF, and STL files follows.

(Snip. That record format info is not here but can be seen at the bottom of the script below.)


Description of the Code

I provide the code for this 3D model file reader-and-examiner Tk script below.

I follow my usual 'canonical' structure for Tk code for this Tk script:


  0) Set general window & widget parms (win-name, win-position,
     win-color-scheme, fonts, widget-geometry-parms, win-size-control,
     text-array-for-labels-etc).

  1a) Define ALL frames (and sub-frames, if any).
  1b) Pack   ALL frames and sub-frames.

  2) Define & pack all widgets in the frames, frame by frame.
     Within each frame, define ALL the widgets. Then pack the widgets.

  3) Define keyboard and mouse/touchpad/touch-sensitive-screen action
     BINDINGS, if needed.

  4) Define PROCS, if needed.

  5) Additional GUI initialization (typically with one or more of
     the procs), if needed.


This structure is discussed in more detail on the page A Canonical Structure for Tk Code --- and variations.

This structure makes it easy for me to find code sections --- while generating and testing a Tk script, and when looking for code snippets to include in other scripts (code re-use).

I call your attention to step-zero. One new thing that I have started doing recently is using a text-array for text in labels, buttons, and other widgets in the GUI. This can make it easier for people to internationalize my scripts. I will be using a text-array like this in most of my scripts in the future.


Experimenting with the GUI

As in all my scripts that use the 'pack' geometry manager (which is all of my 100-plus scripts, so far), I provide the four main 'pack' parameters --- '-side', '-anchor', '-fill', '-expand' --- on all of the 'pack' commands for the frames and widgets.

That helps me when I am initially testing the behavior of a GUI (the various widgets within it) as I resize the main window.

I think that I have used a nice choice of the 'pack' parameters.

The labels and buttons and scales stay fixed in size and relative-location as the window is re-sized --- while the 'canvas' expands/contracts as the window is re-sized.

You can experiment with the '-side', '-anchor', '-fill', and '-expand' parameters on the 'pack' commands for the various frames and widgets --- to get the widget behavior that you want.

---

Additional Experimentation:

You might want to change the fonts used for the various GUI widgets. For example, you could change '-weight' from 'bold' to 'normal' --- or '-slant' from 'roman' to 'italic'. Or change font families.

In fact, you may NEED to change the font families, because the families I used may not be available on your computer --- and the default font that the 'wish' interpreter chooses may not be very pleasing.

I use variables to set geometry parameters of widgets --- parameters such as border-widths and padding. And I have included the '-relief' parameter on the definitions of frames and widgets.

Feel free to experiment with those 'appearance' parameters as well.

---

Note that the color buttons call on a color-selector-GUI script to set the colors.

You can make that color-selector Tk script by cutting-and-pasting the code from the page A non-obfuscated color selector GUI on this site.


Some features in the code

That said, here's the code --- with plenty of comments to describe what most of the code-sections are doing.

You can look at the top of the PROCS section of the code to see a list of the procs used in this script, along with brief descriptions of what they do and how they are called.

See comments in the procs for details on the purpose of each proc and for details on the methods by which each proc was implemented.

Here is a 'condensed' overview of the procs --- to give an idea of the 'guts' of this utility:


   - 'get_model_filename'     - called by the 'Browse...' button on the GUI)

   - 'get_chars_before_last'  - called by proc 'get_model_filename' --- to set curDIR
                                (Could have used Tcl 'dirname' command.)

   - 'load_3DfileData'        - called by bindings on the filetype radiobuttons.
                                This proc calls one of the following 'data loader' procs.

   - 'load_3DfileData_cOBJ'   - for ASCII Wavefront '.obj' files
   - 'load_3DfileData_PLY'    - for ASCII Cyberware '.ply' files
   - 'load_3DfileData_OFF'    - for ASCII '.off' files
   - 'load_3DfileData_STL'    - for ASCII Stereolithography files

   - 'update_counts_label'    - puts counts of vertices, faces, etc. read by
                                a dataloader routine in a GUI label.
                                Called by the above Data Loader procs.

   --------------------

   The following 4 procs are called by several procs below -
   to perform movements of the model geometry and to draw the polygons.

   - 'translate_points_array'
   - 'rotate_points'
   - 'sort_polyIDs_list'
   - 'draw_2D_pixel_polys'

   --------------------

   - 'compare_2polyIDs_by_zdepth' - called by the 'sort_polyIDs_list' proc

    - 'update_drawtime_label'     - shows the draw-time (millsecs) in a label.
                                    Called by the 'draw_2D_pixel_polys' proc.

   --------------------

   - 'load-translate-rotate-sort-draw' - a proc that calls 5 procs:
                                           - load_3DfileData
                                           - translate_points_array
                                           - rotate_points
                                           - sort_polyIDs_list
                                           - draw_2D_pixel_polys
                                       Called by button1-release bindings
                                       on the file-type DataLoader radiobuttons.

   - 'rotate-sort-draw'                -  a proc that calls 3 procs:
                                            - rotate_points
                                            - sort_polyIDs_list
                                            - draw_2D_pixel_polys
                                       Called by button1-release bindings
                                       on the latitude & longitude 'scale' widgets.

   - 'wrap_draw_2D_pixel_polys'        - a proc that calls 1 proc:
                                           - draw_2D_pixel_polys
                                       Called by button1-release bindings
                                       on the Zoom 'scale' widget and on about
                                       six ShadeOptions radiobuttons.
                                       Also called by the 'set_*_color*' procs.

   -------------------------

    - 'set_polygon_color1'    - called by the polygon-fill color button.

    - 'set_polygon_color2'    - called by the polygon-outline color button.

    - 'set_background_color'  - called by the background color button.

    - 'update_colors_label'   - called by the 3 'set_*_color*' procs

   -------------------------

   The following 4 procs are called by some button1-release bindings:

   - 'enable_fillsrc_radbutts'  - to  enable the indicated radiobuttons
   - 'disable_fillsrc_radbutts' - to disable the indicated radiobuttons

   - 'enable_shade_radbutts'    - to  enable the indicated radiobuttons
   - 'disable_shade_radbutts'   - to disable the indicated radiobuttons

   -------------------------

   - 'cross_product_normz'    - to perform 'shading' of the fill color of
                                the polygons, according to the angle
                                that the polygon normals make to a
                                'lighting' vector --- such as the 'view vector',
                                if we assume the lighting is attached to the
                                viewer's forehead, say.
                                Called by proc 'draw_2D_pixel_polys'.

   'popup_msgVarWithScroll'      - to show Help text (and other msgs).

   'popup_msgVarWithScroll_wait' - to show error msgs.


As in my f(x,y) surface-generator-and-examiner script and my f(u,v)-g(u,v)-h(u,v) surface-generator-and-examiner script, one interesting feature of this GUI is the way the procs involved in a redraw are broken up into a sequence.

In this script, the full sequence is

  1. load_points_array
  2. translate_points_array
  3. rotate_points
  4. sort_polyIDs_list
  5. draw_2D_pixel_polys

Some 'events' --- such as click-release on any of the 'data-loader' radiobuttons --- trigger the execution of all 5 procs (in that order), while other events (like longitude or latitude change) trigger the execution of only the last 3 procs.

And some 'simple' changes (like a color change or a switch to wireframe mode) trigger the execution of only the last proc.

Note that I do most of the calculations in 'world coordinates', NOT pixel coordinates.

All the coordinate calculations in the first 3 procs are done in world coordinates.

It is in the 5th proc that I obtain a set of 2D points from a family of 3D points, and I map a 'bounding area' of the 2D points into the current canvas area, in units of pixels --- to finally get the plot, via 'create polygon' commands --- and 'create line' commands, if there are any line-segments in the model.

---

To implement the 'sort_polyIDs_list' proc, I needed to provide a 'compare' proc for the '-command' option of the 'lsort' command. You can see the guts of that proc --- which is named 'compare_2polyIDs_by_zdepth' --- in the code.

Actually, I provide 3 alternate compare scripts in this code:

  • compare_2polyIDs_by_biggerMINzdepth
  • compare_2polyIDs_by_AVEzdepth
  • compare_2polyIDs_by_MAXzdepth

This is because I found that in initial testing on a model with long, 'sliver-shaped' polygons (see the Dilbert's head model below), the first of these 3 procs worked better than the other two.

Eventually, I may enhance this GUI with several radiobuttons by which you can choose from these 3 sort-compare procs (or more). For now, I implemented the first of these 3 compare procs.

---

The 'data-loader' procs may be of use to others who need such 3D data loaders in their Tcl-Tk applications.

The techniques used to load the data can be seen in the procs named

  • 'load_3DfileData_cOBJ'
  • 'load_3DfileData_PLY'
  • 'load_3DfileData_OFF'
  • 'load_3DfileData_STL'

It is my hope that the copious comments in the code will help Tcl-Tk coding 'newbies' get started in making GUI's like this.

Without the comments, potential young Tcler's might be tempted to return to their iPhones and iPads and iPods --- to watch videos of skateboarders kissing concrete.


The Tcl-Tk SOURCE CODE

Here is a link to the CODE for Tk script 3DmodelExaminer_readModelFiles_RxRy.tk

With your web browser, you can 'right-click' on this link --- and in the menu that pops up, select an item like 'Save Link Target As ...' --- to save this file to your local computer.

Then you can rename the file to remove the '.txt' suffix. Make sure that you have execute permission set on the file --- in order to execute the script.


SHADING ISSUES

The following 2 images show that when you choose 'fill-only' for the polygons (no outlines), you can sometimes get pretty nice color shading of the models.

I could not get good shading on the 'gear' model at the top of this page (and the dome image just below) --- with any of the 4 height/depth shading options.

There was a groove on the surface of the gear, around the center of the gear. With any of the four height/depth shading options, the groove did not show up very well.

However, on taking the OBJ 'gear' model into the 'g3dviewer' program that I have installed on my computer running Ubuntu 9.10 Linux, I was able to see the groove quite nicely.

That is because the 'g3dviewer' program is doing the shading by using lighting, rather than height or depth of polygons, to do the shading.

For the initial release of this script, the SHADING option called 'byLighting' is grayed-out (not implemented yet).

I may enhance this script by using a 'cross_product' proc to take into account the angle that polygon normals make with a light direction --- for simplicity, assuming the light is down the z viewing axis, i. e. coming from the user/viewer.

Then I should be able to get nice shading of the gear model --- as well as nice shading on other models such as car, airplane, boat, and StarWars/StarTrek cruiser models, for which I was unable to get pleasing shading via the height/depth shading options.

Probably the computations involved in computing the cross-product for thousands of polygons will increase the draw time considerably.

That is why I did not try implementing that shading method first.


GUI LAYOUT ISSUES

Putting all the non-canvas frames at the top of the GUI, strung out across the GUI, works out well for long horizontal objects --- like cars, airplanes, boats, cows, and the following dome.

For tall objects, like the following lamp-post, it might be better to put many of the frames (like several of the radiobutton frames) into narrower-higher frames on the left (or right) of the GUI.

If I were to get a second burst of energy, I might put a widget (say a checkbutton) on the GUI by which the frames of the GUI would be re-configured --- by use of the Tk 'pack forget' command.

For example, here is a layout for Stucky's 3D viewer, in which most of the non-canvas items are on the left of the canvas.

I changed the Tk widget-packing to put Stucky's controls on the left instead of the top --- and the canvas on the right instead of the bottom --- to get more room, vertically, for the canvas and waste less space on area around the dials.

In a future version of my script (above), when I implement and enable several 'grayed-out' options, I may also change the layout of the GUI, so that I can switch the canvas between 'landscape' and 'portrait' modes.

If I do that, I will probably put 'left-layout' and 'right-layout' radiobuttons on the GUI that will allow the user to quickly move the left frame to the right, and back.

I can do this by using the Tk 'pack forget' command --- as I have done in several other scripts that I have contributed to this wiki.

    (For example, for switching the color-swatch from right to left, and back, in the color-selector script that I mentioned above.)


THE RANDOM COLOR OPTION

The following two images help illustrate the effect achieved by using the 'random' radiobutton from among the 'Fill-color-source' radiobuttons.

The first image shows a bust of Beethoven, in profile, using the fill-and-outline display option --- with color taken from the 'polygon-fill-color' button of the GUI.

The following image shows what happened when I switched the setting of the 'Fill-color-source' radiobuttons from '(use)FillColorButton' to 'random'.

Actually, this image is almost 'too busy' with colors.

The random-colors option may work more nicely on models with fewer polygons.


THE Z-DEPTH POLYGON SORT for PAINTING THE POLYGONS

The following two images show that when there are a lot of polygons in the model and the polygons are not too elongated, the 'painting' of the polygons according to the z-depth sort works out quite nicely --- no significant 'artifacts'.

However, the following crudely-modeled 'head of Dilbert' --- which involves lots of long, 'sliver' polygons --- can lead to poorly hidden polygons.

Notice how one of the ear-pieces of Dilbert's glasses disappears under one of the long, sliver-polygons that runs down the side of his face.

One solution to this problem would be to take the OBJ file of this model into a modeler (like Blender or Wings3D) and re-mesh it with more polygons, none of which are highly elongated.

In fact, here are a couple of images that show what nice results you can get when you mesh a model nicely.

If you look at the meshes of 3D models in a magazine like '3D World', you will see that most modeling professionals use lots of quadrilateral polygons in their models --- especially models of human faces.

Note that there are lots of quadrilaterals in the two models above.


SOME POTENTIAL ENHANCEMENTS:

Eventually some other features may be added to this utility :

  • ** A group of three radiobuttons may be added, like :

    123-to-xyz
    (the current default)

    OR

    231-to-xyz

    OR

    312-to-xyz

    to provide the ability to specify how the 3 coordinates (data columns) of the vertex records will be assigned to the 'local' x,y,z axes of the model.

    In the current implementation of the script, if a model like a car or airplane or boat or cow were built with its longest dimension parallel to the y-axis, and if the two viewing angles are set to zero, the model would load with its 'nose' pointing up or down instead of to the right or left --- or front or rear.

    To simplify the handling of the internal data arrays, this script always goes back to the original data (translated to a point in the middle of the cloud of points) and applies the two rotation angles to that 'original' data, rather than to the current orientation of the points.

    When you rotate a model, say the cow, that was built with its spine parallel to the 'local' y-axis of the model, then it is difficult to get such a model in a good viewing direction (on its feet and facing right, for example) by rotating around the y and x viewing axes.

    We mainly end up spinning the cow around its spine.

    There are several ways to handle this :

    • (1) The way mentioned above, or

    • (2) by rotating the 'current' point coordinates rather than the 'original', or

    • (3) adding a 3rd 'scale' widget for rotation about z ('roll').

    I will probably choose option (1) in order to keep the internal data-array handling relatively simple and to avoid adding another scale widget to the GUI (and to avoid adding 'roll' to the rotation mix).

    Or, one could make three versions of this script --- :-).

    Note that option (1) gives the user a rather unique capability that you do not see in most model viewers --- the capability to change the coordinate axes that were used to originally build the model.

    In any case, by allowing the user to load a model by the '231-to-xyz' OR '312-to-xyz' method, we could more easily get a cow (or car or airplane or boat or StarWars/StarTrek cruiser) into a good viewing position.

    For example, a cow that loads nose-up in the '123-to-xyz' mapping, would load facing the user in the '231-to-xyz' mapping, and would load facing right in the '312-to-xyz' mapping.

  • ** A checkbutton may be added to allow for turning on/off a 'triad' display, that indicates the current direction of the 'local' xyz coordinate axes of the model.

  • ** Some currently 'grayed-out' options could be activated (i.e. implementation may be completed).

    Examples:

    • the 'NASshort' DATA-LOADER radiobutton,
    • the 'byColorTable' FILL-COLOR-SOURCE radiobutton, and the
    • 'byLighting' SHADING radiobutton.
  • ** Add the ability to PAN the model, as well as rotate and zoom it.

  • ** Add the ability to use mouse-motions on the canvas area to move the model. Say: MB1 to rotate, MB2 to zoom, and MB3 to pan the model.

  • ** Radiobuttons could be added to offer several z-depth sorting methods of the polygons --- to allow for alternatives to the 'painting' order of the polygons, and thus alternatives in showing/hiding of 'near' and 'far' polygons --- i.e. alternatives in comparing pairs of polygons to determine which one is nearer the viewer.

  • ** Add shading of the polygons according to the direction of their normals --- to modify the brightness of the polygon faces according to the angle that the polygons make with a light source.

      (Initially we may assume that the light source is coming from the viewer.

      But eventually we may add the ability to specify a different, arbitrary direction of the light source.)

  • ** Depth clipping may be added --- so that the user can essentially get section views of the model.

  • ** More 'data-loaders' may be added --- to support more 3D model file types --- ASCII and perhaps some binary.

    Examples:

    • NASTRAN 'free field' format records, NASTRAN 'long field' format records, or some generic form of the typical CAE/FEA 'node' and 'element' data records

    • a CAD inter-change format such as IGES or STEP,

    • some types of terrain-elevation files.

  • ** A check-button may be added to allow for switching to a 'perspective' view, from the current 'parallel projection'.

  • ** A check-button may be added to allow for 'backface culling', to speed up the plots when lots of polygons are not facing the viewer and perhaps would be hidden --- for example, polygons on the back-side of a sphere or torus or cylinder.

  • ** More elaborate shading techniques may eventually be implemented --- like Gouraud --- to get smoother shading effects across polygon edges, and perhaps to get glossy effects.

      (These effects may be easiest to implement by using colors assigned to polygon vertex points rather than colors assigned to polygons.)

    This would really slow each plot down, but having the option might be worth it, to get a higher quality image --- if it can be done within 10 to 30 seconds for a 2,000 face model, say.

    (Unfortunately, there is no Gouraud option built into the Tk 'create polygon' command for the canvas. I would like to suggest this for Tk 9.0 --- at least in the case when the polygons are triangles --- allow for specifying a different color at each of the 3 vertices.)

  • ** No doubt, there are some ways to change the calculations and/or procedures to get a significant speed up of the redraws and thus allow for smooth rotation of fairly large models.

      Several months after 'publishing' this script, I found that I could use floating-point numbers in the Tk canvas plot commands, instead of integer numbers.

      I had converted the variables that hold the vertex coordinates to variables holding integer coordinates, and supplied those integer variables to the Tk canvas plot commands.

      If I ever use these procs for 3D transformations, I may remove the code that changes from floating-point to integer variables, and let the Tk canvas plot commands handle the conversion from floating-point numbers to integer pixel coordinates. This may provide some speed up of the draws.

    If this script were changed to allow for 'immediate' rotation according to mouse motion on the canvas, then the rotation will definitely be a bit 'jumpy' --- even for 'small' models on the order of a few thousand polygons.

    So it behooves one to find ways to speed up the procs in the 'graphics pipeline'.

  • ** This enhancement list may be extended.

I may add a few more ideas for enhancements to this script in coming months (or years), as I tackle other 3D utilities.


SCALES ('SLIDERS') RESPONSE

'-repeatdelay 500' and '-repeatinterval 50' parameters are present on all three scales.

If the responsiveness of the sliderbar movements is not to your liking (when you press-and-hold mouse-button-1 over a scale's trough --- to rapidly make changes of about 5 to 10 degrees in a view angle), you can change these milliseconds values.


THREE GRAYED-OUT OPTIONS

There are three grayed-out (unfinished options) on this GUI:

  • the unfinished 'NASshort' data-loader radiobutton option

  • the unfinished 'fromColorTable' FILL-COLOR-source radiobutton option

  • the as-yet unimplemented 'byLighting' shading-radiobutton option.

I may implement these 3 options in the future --- if not in this script, then perhaps in another 3D utility script.

If/when I do that, I may replace the code here with new, enhanced code that implements one or more of these grayed-out options.

If/when the 2nd of these 3 options is implemented you will be able to apply colors to models in a model x,y,z coordinate direction or in the z-depth viewing direction.

For example, on choosing the 'fromColorTable' option applied in a 'model-axis' direction, you could get a model display like the following.

But I intend to supply a color table with at least 18 colors, so that you can get a fairly fine color distribution.

And, if I allow for color-shading (like Gourad) on top of that, you will be able to get some pretty nice effects with the color-table.

Because the Tk script is open source, if the color table were 'hard-coded' in the script, you could change the colors in the color table --- and even change the number of colors in the table.

And, eventually, one could provide a way to change colors in the color table via the GUI.

    I would probably supply the color table in a simple text file that the user could replace with their own file containing different colors and a different number of colors.


SOME SOURCES OF 3D MODELS

3D model files can get quite large. Here are some sites (available in 2013 Jan) from which you can get a variety of model sizes and types for use with this 3D model examiner.

OBJ files:

PLY files:

OFF files:

STL files:

OBJ,PLY,OFF,STL files:

  • Files meant for testing in HTML links with web browser helper apps are at
    subdude-site.com --- pages on some 3D viewer and converter programs on Linux.

  • A site that seems to be actively updated in the 2013-2016 timeframe is
    lodbook.com/models/ --- 'Level of Detail for 3D Graphics - 3D Models'.


In the 2012 to 2015 time frame, it was getting harder and harder to find 3D model sites that offer their simpler models for free.

Many sites that were offering free models started charging for even very simple models --- or at least requiring 'registration' --- that is, requiring you to expose yourself to unwanted junk mail by requiring you to give an email address.

    It is disgusting how many web sites are trying to 'monetize' all of their web pages by loading them up with so many references to 'third-party' CDN ( Content Delivery Network) sites that their pages take many seconds to load.

    When I encounter pages like that, I quickly exit ... never to return.

You might have better luck finding 3D models by doing web searches that include the name creative commons --- to find sites offering models under a 'public domain' Creative Commons License.

For example, you could try a search using keywords such as
3d model files creative commons.

Add other qualifiers to search for particular types of files --- such as 'car' or 'airplane' or 'human' or 'toon' or whatever.


NEXT 3D PROJECTS

The three 3D-viewer scripts that I have developed so far have given me a wealth of procs and techniques that will be very useful to me.

The procs of these 3 scripts will be useful for other 3D Tk-script projects --- such as generation-and-viewing of terrain surfaces --- the next 3D project on my to-do list.

In that project, I will be reading in an image file (GIF or PNG), instead of a 3D model file (OBJ, PLY, OFF, STL, etc.).

Bottom of this page for a
3D Model Examiner that reads 3D model files --- a utility in the FE 'tkGooies' system,
in the '3Dtools' group.

To return to a previously visited web page location, click on the Back button of your web browser a sufficient number of times. OR, use the History-list option of your web browser.
OR ...

< Go to Top of Page, above. >

Page history:

The first version of this code was posted 2013 Jan 17 at http://wiki.tcl.tk/37565.

This FE web page was created 2014 May 05 --- as a backup and alternative to the wiki.tc.tk page (and site).

Page was changed 2016 Jan 01.
(Added some links and some paragraphs.)

Page was changed 2019 Feb 23.
(Added css and javascript to try to handle text-size for smartphones, esp. in portrait orientation.)

Page was changed 2019 Jun 16.
(Specified image widths in percents to size the images according to width of the browser window.)


NOTE:
The code here MAY become more 'up-to-date' than the code posted on the Tcler's Wiki ---
wiki.tcl-lang.org --- formerly wiki.tcl.tk.