|
This Tk coding structure is discussed in more detail on the page
A Canonical Structure for Tk Code --- and variations.
This makes it easy for me to find code sections --- while generating
and testing Tk scripts, and when looking for code snippets to
include in other Tk scripts (code re-use).
Experimenting with the GUI
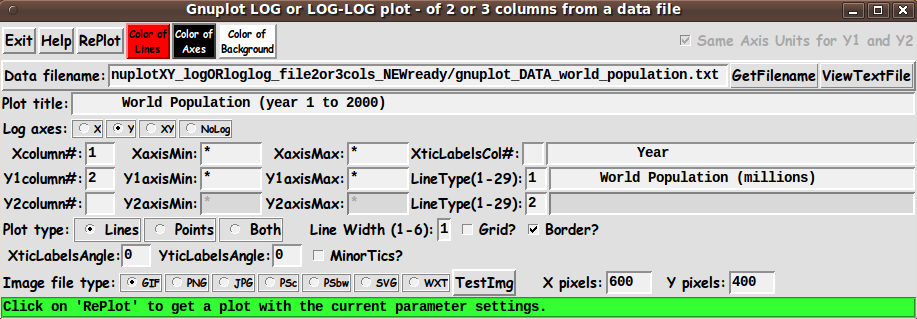
As in all my scripts that use the 'pack' geometry manager (which
is all of my 100-plus Tk scripts, so far), I provide the four main
'pack' parameters --- '-side', '-anchor', '-fill', and '-expand'
--- on all the 'pack' commands for the frames and widgets.
I think I have found a good setting of the
'-side', '-anchor', '-fill', and '-expand' parameters on
the 'pack' commands for the various widgets of this GUI.
In particular ...
The filename, plot-title, axis-titles entry widgets expand/contract
appropriately when the window size is changed --- and button and
label widgets stay fixed in size and relative-location as the
window size is changed.
Furthermore 'entry' fields for column-numbers, axis-limits,
line-width/types, and pixel-sizes stay fixed in size.
If anyone wants to change the way the GUI configures
itself as the main window size is changed, they can experiment
with the '-side', '-anchor', '-fill', and '-expand' parameters
on the 'pack' commands for the various widgets --- to get the
widget behavior that they want.
---
Additional experimentation:
You could change the fonts used for the various GUI widgets.
For example, you could change '-weight' from 'bold' to 'normal' ---
or '-slant' from 'roman' to 'italic'.
Or change font families.
In fact, you may NEED to change the font families, because
the families I used may not be available on your computer ---
and the default font that the 'wish' interpreter chooses may not
be very pleasing.
Furthermore, there are variables used to set geometry parameters
of widgets --- parameters such as border-widths and padding.
Feel free to experiment with those parameters as well.
---
Note that the 3 'Color' buttons call on an RGB color-selector-GUI script
to set the colors.
You can make that color-selector script by cutting-and-pasting the code from
the page offering
'a non-obfuscated color selector GUI', on this site.
Some features of the code
There are plenty of comments in the code to describe
what most of the code-sections are doing.
See the 'PROCS' section of the code to see the code in all the procs
that are used in this Tk script.
The main plotting code is in the proc 'replot'.
See the comments in that proc for details on how the plotting
is implemented by creating a 'gnuplot' script of commands
to pass to the 'gnuplot' program.
Here is a list of the procs in this Tk script:
- get_filename
- view_file
- replot
- display_test_img
- edit_inputs
- getset_color
- update_color_button
- popup_msgVarWithScroll
Although it sounds like stating the obvious, it is probably worth
mentioning that the 'get_filename' proc is called by the
'GetFilename' button, and the 'replot' proc is called by
the 'RePlot' button --- and the 'getset_color' proc is called by
the 'Color' buttons.
The 'update_color_button' proc is called (once for each color button)
near the bottom of the Tk script to initialize the GUI, after
initializing some color variables.
And the 'update_color_button' proc is also called in the
'getset_color' proc.
Just a few more comments on some 'features' of this script:
-
ViewFile:
After using a similar Tk 'gnuplot-frontend' utility on a few test files,
I found that it would be handy to open the data file in a
text file browser . . .
for example, in order to see the comments that I put
at the top of a file, to help in setting titles --- or to
see the data columns, to set min,max values for over-riding
the default 'autoscale' functionality of 'gnuplot'
(i.e. replace the asterisks in the min,max entries
with numeric values).
So I added a 'ViewFile' button to the GUI --- and the 'view_file'
proc is called by that button.
A 'TXTFILEviewer' variable can be used to set the
text-file-viewer program to use.
I have it set to use the FE 'xpg' utility.
By the way, 'gnuplot' recognizes '#' as a comment line indicator
in a data file. And 'gnuplot' allows you to change that indicator.
-
EditInput:
The 'edit_inputs' proc is called by the 'replot' proc to check
the entries on the GUI . . .
to check that they are the proper numeric type,
in the proper range, etc.
If there is an exception, the 'popup_msgVarWithScroll' proc
is used to popup a message to the user.
The 'popup_msgVarWithScroll' proc is also called by
the 'Help' button to show the text in the 'HELPtext' variable,
which is set at the bottom of the script.
-
Output Display:
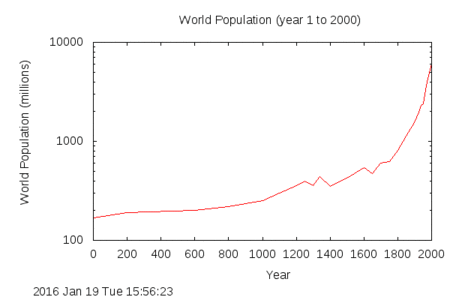
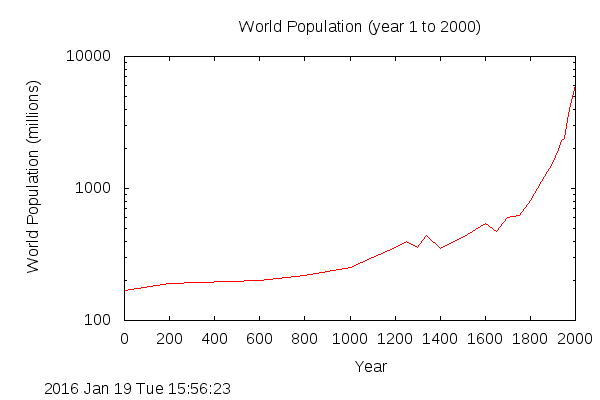
'gnuplot' typically renders the plot into an output file in a fraction
of a second.
Some 'viewer' variables are used in this Tk script to set the
viewer program to use for the various output types.
I have set the viewer variables as follows:
- set GIFviewer "/usr/bin/eog"
- set PNGviewer "/usr/bin/eog"
- set JPGviewer "/usr/bin/eog"
- set PSviewer "/usr/bin/evince"
- set SVGviewer "/usr/bin/inkscape"
where 'eog' is the 'Eye of Gnome' image file viewer utility.
'evince' is a PDF and Postscript file viewer.
Inkscape is an SVG editor. Inkscape is slow to open.
It might be just as fast to use a web browser,
like Firefox, as the SVG viewer.
Comments in the Code
It is my hope that the copious comments in the code will help Tcl-Tk
coding 'newbies' get started in making GUI's like this.
Without the comments, potential young Tcler's might be easily frustrated
and be tempted to return to their iPhones and iPads and iPods ---
to watch how celebrities are mis-behaving . . .
while the really 'lasting', significant stuff is being done by
inventors, researchers, engineers, scientists (physicists, chemists,
biologists, etc.), architects, and millions of crafts-people and
manufacturers, including carpenters, electricians, plumbers,
iron-workers, bridge-builders, tunnel-builders, etc.
(Try the
Science channel for some really interesting programming ---
like the "How It's Made" and "How the Universe Works" and
"Outrageous Acts of Science" series.)
The Tcl-Tk script CODE
Here is a link to CODE for the script
'tkGnuplotXY_logORloglog_file2or3cols.tk'.
And here is a link to a SAMPLE DATA file
'gnuplot_DATA_world_population.txt'.
I have most of the entry field variables set, in
an 'Additional GUI Initialization' section near the
bottom of the Tk script, to accomodate this test file
when you first try this Tk GUI.
Other 'gnuplot' utilities
This is the fifth of several 'gnuplot front-end' utilities
that I had planned to write. See the links to 4 others at the
top of this page.
I still have a few more in mind.
Other Tk 'gnuplot front-end' scripts that may follow are:
-
MANY-LINES-with-LEGEND plot:
a many-column xy-plot, created by selecting many columns of data,
say, up to 10, from a text file containing columns of data ---
with text-strings in the file containing names that can be used
for a plot 'key' (legend) for the many lines on the plot.
-
MAPS plot:
a front-end to plot maps in 2D or 3D form, which 'gnuplot' is
capable of doing.
-
PIE plot:
a front-end to do pie-plots, which 'gnuplot' was not originally designed
to do, but which some people have accomplished with 'gnuplot'
Future Enhancements:
I have not tested this script extensively.
No doubt, if I use it some more, I will find a few things to
change, add, or fix.
I pointed out, above, that I may someday implement the 'Same Scale for Y1,Y2'
checkbutton.
In that case, if a user unchecks the button, several entry
fields on the GUI would be changed from 'disabled' mode to 'enabled' mode.
For example, the Y2 min,max entry fields and the Y2 axis label entry field
would be enabled.
'gnuplot' TERMINAL TYPES:
I have provided for most of the 'gnuplot' 'terminal types' for output.
Note that I have provided for 2 types of Postcript output ---
color and black-and-white.
The 'PSc' option implements 'terminal postscript landscape color colortext'.
The 'PSbw' option implements 'terminal postscript landscape mono blacktext'.
Furthermore, I have enabled the 'WXT' terminal type.
The 'wxt' terminal uses the
wxWidgets library, which is where the 'wx' comes from.
The actual drawing is done via
Cairo, a 2D graphics library, and
Pango, a library for laying out and rendering text.
The 'wxt' terminal may offer the ability to get some high-quality output,
because it may offer better quality lines and text (perhaps due to better
anti-aliasing).
However, the 'wxt' terminal does not write to an image file.
The output is put in a terminal window.
To get an image file, the user can use a screen-capture utility
(such as 'gnome-screenshot' on Linux) to get the image in a PNG file.
Then an image editor (such as 'mtpaint' on Linux) can be used
to crop and resize the image file, if necessary.
And a command like 'pngcrush -brute' can be used to minimize the size
of the final PNG file.
At this time (2016 Feb), I do not plan to add anymore 'terminal types'
to the GUI.
As I point out at the bottom of the 'HELPtext' for this Tk script,
someday I may try to get more appealing plots --- with color
gradient backgrounds and with 'shadow curves' and with 'ribbon curves'
--- by using some of the 'gnuplot tricks' of Zoltan Voros,
that can be seen at 'www.phyast.pitt.edu/~zov1/' in
If those pages are no longer available,
you can see a couple of examples of that high-quality 'gnuplot' output
at the bottom of a page on
a Tk GUI Front-End for 'gnuplot' - for generating MATH EXPRESSION xy-plots -
allowing for up to 3 math expressions on a plot.
By the way, here is the gnuplot script file that was created
in one of my test runs.
|


