FE 'tkGooie' Utilities

'SYSTEMtools' group

A Meters for
Network-Activity
utility

(using HiDef
Background Images)

(FE = Freedom Environment)

GUI that shows network
'interface' activity
---
packets Received (Rx)
on the left
and
packets Transmitted (Tx)
on the right
---
in packets/second.

FE Home Page > FE Downloads Page >

FE 'tkGooies' Description Page >

FE 'tkGooies' 'SYSTEMtools' Menu >

This
'Meters_forNetStats_ HiDefBkgdImg'
tkGooie code Page

INTRODUCTION to Tcl-Tk script
'Meters_forNetStats_ HiDefBkgdImg'

In 2013, I posted code at 4 different wiki.tcl.tk pages for some system monitoring utilities that use a 'tachometer style' meter.

The meter appearance was based on a meter style for which Marco Maggi provided a demo script at wiki.tcl.tk/9107 back in 2003.

The four pages that I posted at wiki.tcl.tk are backed up as HTML pages on this site at the following pages.

Those meters (Marco's and mine) were built using 'create arc', 'create oval', 'create line', and 'create text' commands on a Tk canvas.

And Marco's 'shadow-circle' technique was used to make a nice-looking meter background.

I explained on the wiki page 'A Tachometer-style Meter --- for CPU Usage' why I decided to go with a single meter on the GUI --- rather than 2 meters, like the 2 meters in the 'memory-and-swap' and the 'network-activity' Tk GUI's that I had devised before.

In fact, I patterned the CPU usage GUI on the 'single-meter' GUI that I used for the 'file-system-usage' Tk GUI that I devised before.

On the other hand, it proved more natural to use a 'double-meter' GUI for the memory-and-swap and the network-activity utilities.

The 2-meter approach was natural for the network-activity utility because --- for a user-specified network interface, such as 'eth0' --- the utility was meant to show the current packet transmission rate for both received and transmitted packets.


Those 'create arcs-and-lines and shadow-circle' meters were quite nice, BUT ...

At the bottom of my page, 'A Tachometer-style Meter --- for CPU Usage', I mentioned that I may try using a 'create image' technique on a Tk 'canvas' widget to make HD (high-definition) meters.

I did that in 2013 December and the resulting code (with plenty of descriptive text) is available at wiki.tcl.tk --- and on this freedomenv.com site at
a 'Meter_forCPUsUsage_HiDefBkgdImg' page.

It was on my Tk-GUI to-do list to make 'hi-def meter' GUI's for the other 3 monitoring utilities:

  • memory-and-swap usage

  • network activity

  • file system usage

Finally, about 2 years later, in 2015 November, I made a similar 'hi-def meters' Tk GUI script for a 'memory-and-swap' monitoring utility.

That code is available on this freedomenv.com site at

a 'Meters_forMemoryAndSwap_
HiDefBkgdImg' page
.

The subject of this page is to provide code for a pair of HiDef-style Meters --- to display 'network activity' for a user-selected network interface.

Code, screenshots, and description of that utility are below.


Method of Data Collection

Like the network-activity-meters implementation posted on the wiki page

'A Pair of Tachometer-style Meters
--- for Network Activity'
,

this implementation provides a Tk script that is a 'wrapper' for a shell script that extracts output from the 'netstat -i' command.

See that page for the code of the shell script (or see the shell script code below).

Comments in the code give an example of the output from the 'netstat -i' command.

It is also pointed out in the shell script that other commands, other than 'netstat', could be used --- such as 'ifconfig -a -s'.

As was noted on the 'Tachometer-style Meters --- for Network Activity' page, this utility is probably usable on BSD and Mac (and Unix) systems --- perhaps with some changes to the shell script, if necessary.

And for almost any Linux system with an 8.x Tcl-Tk 'wish' interpreter installed, this utility should be usable with essentially no changes.

I implemented a periodic-sampling ability by use of the Tcl 'after' command, in the form

after   $WAITmillisecs   update_pointers

as explained on the 'A Tachometer-style Meter --- for CPU Usage' page and on my other 'Tachometer-style Meter' pages.


A DESIGN for the Tk GUI

Two Meters:

For this 'hi-def meters' GUI, it was a no-brainer to go with 2 meters, like the 2 meters in the 'network activity' Tk GUI that I had devised before --- as seen on the page

'A Pair of Tachometer-style Meters
--- for Network Activity'
.

In putting together the code for this GUI, instead of using the 'shadow-circle' technique of Marco Maggi to make nice looking meters, I collected some nice background images and used 'create image' on Tk canvas widgets to make a background for the meters.

---

'Refresh' button:

Like with the 'create arcs-and-lines and shadow-circle' network-activity GUI, I wanted to supply a 'Refresh' button on the GUI, so that the user can request at ANY TIME, a new query of the rate data for the network interface being monitored.

This is especially helpful if you have the sampling interval set at some value and you decide that the sampling interval is shorter or longer than needed.

You can intervene immediately to change the sampling interval.

---

The Network Interface:

Like with the 'create arcs-and-lines and shadow-circle' network-activity GUI, I wanted to supply an 'Iface' button on the GUI, so that the user can get a list of network interface names on the computer.

The user can use any of those interface names in an entry field on the GUI.

---

Received and Transmitted Packets:

For the user-specified network interface, the two meters show, via 'pointers' on the meters, the rate of packets received and the rate of packets transmitted --- in packets per second.

Since the packet rates do not have a fixed maximum, we do not have the meters marked off from 0 to 100 percent.

Rather we use a range of 0 to 1000 packets per second.

If there is a burst of activity that results in a rate of more than 1000 packets per second, the GUI shows the pointer 'pegged' at 1000.

    (Of course, if you found that your system was regularly 'pegging' one or both rates at 1000, you could change the Tk script to increase the maximum value of the meter tic marks.)

Since it is often nice to know the cumulative number of packets received and transmitted, the GUI shows the 'total' received and transmitted packets, as returned by the 'netstat' command.

The two packet rates are also shown numerically as well as via the position of the 'pointer' on the meter.

So there are two text lines above the two meters.

(You can see this in the image at the top of this page --- or in the images below.)

---

Tics-Arc and Tic-Marks:

I have still used 'create line' to make optional tic-marks (useful if tic marks are not included on the background image).

And I have used 'create arc', to (optionally) provide a drawing of the arc along which the tic marks are located.

Furthermore, I have used 'create text' to (optionally) provide numeric labels for the tic marks --- and to place a text string --- 'Pkts/sec' --- on the face of the meter.

---

Themes

Since I am using 'create image' to create the meter backgrounds, that opens up the possibility of giving the user a choice of background images --- and 'pointer' images (corresponding to the 'needle' on the Maggi-style meter) --- and 'corner-feature' images (corresponding to the 'rivets' on the Maggi-style meter).

In fact, I decided to allow an unlimited set of themes --- by using Tcl arrays to hold a set of parameters for each theme.

Below is an example of the 'set' statements and array names that are used to define a theme indexed by the integer 1.


  set aRimgBkgd(1) "meter_background_A23_metallicKnob_indentedBlueGrayEdge_lightGrayBkgd"
  set aRticsYorN(1) "N"
  set aRcenterX(1) 0.505
  set aRcenterY(1) 0.51
  set aRradiusArc(1) 0.35
  set aRinORout(1) "out"
  set aRhexcolorText(1) "#000000"
  set aRhexcolorTics(1) "#000000"
  set aRimgPointer(1) "bullet_blueHilited_transp_26x26"
  set aRimgCornerFeature(1) "screwheadHex_transp_32x32"
  set aRstartAngle(1) -70
  set aRextentAngle(1) 320

The array 'aRimgBkgd' holds the 'prefix name' of the background image file for the theme.

According to the setting of S-M-L radiobuttons on the GUI, the suffix '_SMALL' or '_MEDIUM' or '_LARGE' is added to this name.

And a file suffix of '.gif' or '.png' is added to get the complete name of the file to be used for the meter background.

The use of '.gif' or '.png' is determined by an 'imgSUFFIX' variable, mentioned further below, in relation to naming of the 'pointer' and 'corner feature' image files.

The array 'aRticsYorN' is used to indicate whether the background image already has tic marks on it.

If it is set to 'Y', then no tick marks (nor circular arc) need to be drawn by the 'make_one_meter' proc.

The factors 'aRcenterX' and 'aRcenterY' (between 0 and 1) are used to help locate the center of the arc-circle, especially in those cases when the background image is not symmetric, in other words, off-center.

The array 'aRradiusArc' is used to adjust the radius at which the tick marks and tick labels are drawn.

The array 'aRinORout' is used to determine whether this theme should draw the tick marks and tick labels to the outside of the arc-circle or the inside of the arc-circle.

The array 'aRhexcolorText' is used to set the color of the tick mark labels and other text labels on the meter.

The array 'aRhexcolorTics' is used to set the color of the tick marks.

The array 'aRimgPointer' holds the name of the 'pointer' image file, minus its suffix --- '.gif' or '.png'.

The array 'aRimgCornerFeature' holds the name of the 'corner feature' image file, minus its suffix.

Generally, the person setting up theme files will want to use transparent GIF's or transparent PNG's for these image files.

There is an 'imgSUFFIX' variable, in the 'Additional GUI Initialization' section at the bottom of the Tk script, that can be set to 'gif' or 'png', to determine which type of image file the user is using for the 'aRimgBkgd' and 'aRimgPointer' and 'aRimgCornerFeature' files.

The arrays 'aRstartAngle' and 'aRextentAngle' are used to specify a start-angle and extent-angle for drawing the tic-marks arc.

The start-angle is specified relative to a horizontal, right-pointing x-axis.

---

Resizing the meter

In my implementation of the Marco-Maggi-like meter, I spent quite a bit of effort in converting Maggi's procs

  • FROM using hard-coded numbers for making the meters and their needles

  • TO using variables that are set based on a query on the current size of a frame or canvas widget.

So the user is able to resize the window and click on the 'Refresh' button to get a bigger version of the meter and the needle position.

One advantage of building the entire meter with 'create oval,arc,line,text' is that the meter can be resized within a 'continuum' of sizes by using some simple arithmetic.

For reasons outlined at the bottom of the

'A Tachometer-style Meter
--- for CPU Usage' page
,

I provide small/medium/large radiobuttons on the GUI --- by which the user can choose 3 different image sizes, from among the images for a user-selected theme.


SOME GUI IMAGES
of implementation of the design

On the basis of these goals, I ended up with a GUI with Tk 'label', 'button', 'entry', 'radiobutton', 'checkbutton', and 'scale' widgets --- and a multitude of theme possibilities (say, ten or more) --- as seen in the following images.

Below is the GUI as it appears on startup --- with the S/M/L radiobuttons defaulted to Small, and the theme number defaulted to one, and the several theme-features checkbuttons turned on.

Below is the GUI after clicking on the 'M' (Medium) radiobutton.

Below is the GUI after switching OFF the 'CornerFeatures' checkbutton.

Below is the GUI after switching OFF the 'DrawTicsArc' checkbutton.

Below is the 'Small' version of the meter-background image used above --- with links to the 'Medium' and 'Large' versions of the image file.


Medium   Large

Not only can one use high-quality meter backgrounds like the one above, but one can choose from other Small-Medium-Large images like the 'Small' ones below --- with links to Medium and Large images.


Medium   Large


Medium   Large


Medium   Large


Medium   Large


Medium   Large
Note:
There is color-banding in this GIF file.
There was no color-banding in the PNG file
from which this GIF file was made.
There were just too many shades of blue
in the PNG file for a GIF file to handle,
because the GIF 'palette' is typically
limited to 256 colors.

The bright side of this story is that
the images above and below demonstrate that
we can still find quite nice GIF file images to use.


Medium   Large


Medium   Large


Medium   Large


Medium   Large


For this implementation, rather than try to use 'needle' pointers and incur extra processing dealing with orienting the needle at any of about 300 degrees or more around the meter arc, I decided to use blunt 'bullet' pointers like the following.

I also decided to use one size of 'pointer' for a given theme, rather than use S/M/L sizes.


Similarly, for this implementation, rather than try to use 'corner features' (rivets, screw-heads, and the like) of Small/Medium/Large sizes, I decided to use one size for any theme chosen.

Below are some sample corner features.

Of course, the Tk script could be rather easily changed to accomodate S/M/L 'pointers' and S/M/L 'corner_features'.

---

Sample count

As mentioned on the 'tachometer-style-meter' pages, the integer shown just to the right of the sample-rate 'scale' widget is a sample-count.

I found that it is helpful to have this count displayed in cases when the 'pointer' and the numbers on the GUI are not changing perceptibly --- so that the user is assured that the sampling is taking place, and at the rate that is currently requested.

---

The initial display

In making the Small, Medium, and Large images for each 'theme', I made the 'Small' image about 200x200 pixels, the 'Medium' about 350x350, and the 'Large' about 500x500 pixels.

When the GUI first comes up, the meter is defaulted to showing theme number 1, the 'Small' sized image.

The rate data (packets per second) shown initially is based on an initial PAIR of executions of the shell script that extracts data from the 'netstat' command.

    (Of course, the shell script could easily be changed to get the data via another command such as 'ifconfig'.)

You can easily change various defaults for the initial appearance of the GUI by changing some 'set' statements in the 'Additonal GUI Initialization' section at the bottom of the Tk script.

---

The "Pointer"

In the Maggi-style meter, a 'needle' was drawn using 'create line'.

I had hoped to come up with a technique to avoid the 'aliasing' effect on the needle --- but I did not devise a successful technique for any of the 4 Maggi-tachometer-style-meter scripts that I have created so far.

I considered trying to collect or create high-definition needle images and try to place them on the canvas by rotating the image at suitable angles.

However, I decided to avoid the processing in doing that.

I could try building on the rotate-image code that I used in a Tk script donated to the Tcler's Wiki on a page originally titled

'Rotate TkPhoto Image
- via GUI with File and Bkgd-Color Select
- 2 scrollable canvases'

and add the code necessary to deal with transparency data (which Tk supports) in a GIF (or PNG) image.

But I have some doubts about how well that would work out --- performance-wise.

Besides that will take more development time that I would prefer to devote to other projects at this time.

I also decided to avoid the alternative of making about 180 to 360 needle files, with the needle at various angles --- for each style of needle image for the themes.

---

Another approach to making 'pointers':
(other than 'needles')

In searching for ideas for meter background images, I stumbled upon some images of 'knobs' where the position of the rotary knob was indicated by lighted 'spots' around the knob.

I decided that I could use images like 'bullet' icons to indicate a position around the arc of the meter.

The Tk 'canvas' widget supports transparency, so using small transparent GIF's (or PNG's) is feasible.

So besides a background image for the meter, I have allowed for a 'pointer' image and a 'corner feature' image (like a rivet or screw head) to be supplied in each 'theme'.

And if a 'pointer' image is not supplied for a theme, I fall back to using code like that used in the 'tachometer-style-meter' Tk script --- to draw a red needle with 'create line'.


CAPTURING THE GUI IMAGE:

When you have a GUI image that you want to save, a screen/window capture utility (like 'gnome-screenshot' on Linux) can be used to capture the GUI image in a PNG or GIF file, say.

If necessary, an image editor (like 'mtpaint' on Linux) can be used to crop the window capture image.

    (The image could also be down-sized with the image editor --- say, to make a smaller image suitable for presentation in an email or on a web page.)

This is the technique that I used to prepare the GUI images that I posted above, to show some GUI features of this utility.

However, I replaced the relatively large PNG files that came from the 'mtpaint' editing step with smaller 'crushed' files that were created by the 'pngcrush' command.


DESCRIPTION OF THE CODE

Below, I provide the Tk script code for this 'high-definition memory-and-swap usage' graphical display utility.

I follow my usual 'canonical' structure for Tk code for this Tk script:


  0) Set general window & widget parms (win-name, win-position,
     win-color-scheme, fonts, widget-geometry-parms, win-size-control,
     text-array-for-labels-etc).

  1a) Define ALL frames (and sub-frames, if any).
  1b) Pack   ALL frames and sub-frames.

  2) Define & pack all widgets in the frames, frame by frame.
              Within each frame, define ALL the widgets.
              Then pack the widgets.

  3) Define keyboard and mouse/touchpad/touch-sensitive-screen action
     BINDINGS, if needed.

  4) Define PROCS, if needed.

  5) Additional GUI initialization (typically with one or more of
     the procs), if needed.


This Tk coding structure is discussed in more detail on the page A Canonical Structure for Tk Code --- and variations.

This structure makes it easy for me to find code sections --- while generating and testing a Tk script, and when looking for code snippets to include in other scripts (code re-use).

I call your attention to step-zero.

One thing that I started doing in 2013 is to use a text-array variable --- named 'aRtext' --- for text in labels, buttons, and other widgets in the GUI.

This can make it easier for people to internationalize my scripts.

I will be using a text-array like this in most of my scripts in the future.

---

I put the arrays that define the themes just under the code that sets the widget-text strings.

So the themes can be changed or augmented by going to the same section of the code where one can go to alter most of the text strings appearing on the GUI.


Experimenting with the GUI code

As in all my scripts that use the 'pack' geometry manager (which is all of my 100-plus scripts, so far), I provide the four main 'pack' parameters:

  • '-side'
  • '-anchor'
  • '-fill'
  • '-expand'

on all of the 'pack' commands for the frames and widgets.

That helps me when I am initially testing the behavior of a GUI (the various widgets within it) as I resize the main window.

I think that I have used a pretty nice choice of the 'pack' parameters.

In particular ...

The label, button, entry, radiobutton, and checkbutton widgets stay fixed in size and relative-location if the window is re-sized --- while the canvas area (without scroll bars) expands/contracts whenever a Small, Medium, or Large image is chosen via the radiobuttons.

    You can experiment with the '-side', '-anchor', '-fill', and '-expand' parameters on the 'pack' commands for the various frames and widgets --- to get the widget behavior that you want.

---

Additional experimentation with the GUI
--- its appearance:

You might want to change the fonts used for the various GUI widgets.

For example, you could change '-weight' from 'bold' to 'normal' --- or '-slant' from 'roman' to 'italic'.

Or change font families.

    In fact, you may NEED to change the font families, because the families I used may not be available on your computer --- and the default font that the 'wish' interpreter chooses may not be very pleasing.

I use variables to set geometry parameters of widgets --- parameters such as border-widths and padding.

And I have included the '-relief' parameter on the definitions of frames and widgets.

Feel free to experiment with those 'appearance' parameters as well.

If you find the gray 'palette' of the GUI is not to your liking, you can change the value of the RGB parameter supplied to the 'tk_setPalette' command near the top of the code.


Some features in the code

There are plenty of comments in the code to describe what most of the code-sections are doing.

You can look at the top of the PROCS section of the code to see a list of the procs used in this script, along with brief descriptions of how they are called and what they do.

The procs are structured to accomodate putting more than one meter on the GUI.

The main procs are as follows.


    'make_meters' - to draw meter(s) within Tk canvas(es).

                    The size of the 2 canvases will be determined
                    by the size of the background image, which in
                    turn is determined by the theme-index and
                    the setting of the Small-Medium-Large radiobuttons.

    'make_one_meter'      - to draw one meter. Called by 'make_meters'
                            to make the meter(s).

    'update_pointers'     - to update the 'pointer(s)' on the meter(s).
                            Called initially at the bottom of this script.
                            And called in the 'Refresh' proc.

                            Calls on the 'get_memory_and swap.sh' script
                            to get data to position the 2 pointers.

   'update_one_pointer'  - to place one 'pointer' on a specified meter/canvas.
                           Called by 'update_pointers' to update each of the
                           pointers on the 2 meters.

   'Refresh'             - called by the 'Refresh' button. Runs the procs
                           'make_meters' and 'update_pointers'.

                           In particular, this proc can be used to
                           force the meters to be resized if the user
                           click-releases on one of the S-M-L radiobuttons.
                           And this proc is used whenever the user wants
                           a new start of the sampling, for example, on
                           changing the sample rate with the sample-rate scale widget.

   'sho_ifaces'           - called by the 'Ifaces' button. Shows available
                            network interfaces, in a popup message window.

 'popup_msgVarWithScroll' - to show the HELPtext var. Called by the 'Help' button.
                            Also used by 'sho_ifaces' to show the list of interfaces.


Thanks

Thanks to Marco Maggi whose tachometer-style-meter influenced the making of this meter utility --- with features such as using an arc of tic-marks, and allowing for corner-decorations (rivets in the case of the original Maggi demo code).


Comments in the Code

It is my hope that the copious comments in the code will help Tcl-Tk coding 'newbies' get started in making GUI's like this.

Without the comments, potential young Tcler's might be tempted to return to their iPhones and iPads and iPods --- to watch videos of television hosts asking 'experts' to predict the future --- the future of the economy, the future of wars, the future of elections --- when it is clear that these hosts are just filling time between the commercials --- which pay the hosts their salaries --- for asking people to predict the future.

    'News show expert' --- an easy, paying (stupid, unrewarding) job if you can get it.

    Just blather your opinions into the camera.

'News' shows have turned into 'opinion' shows.

CNN (Cable News Network) should be renamed CON (Cable Opinions Network).

And Fox News should be renamed Fox Opinions.


The Tcl-Tk CODE

Here is a link to CODE for the Tcl-Tk script

'meters_netstats_hidef-image.tk'.


The shell script (the 'wrapee') :

Here is a link to CODE for the SHELL script called by this Tk script.

'get_net_stats.sh'

This is the same shell script that I supplied on the page 'A Tachometer-style Meter --- for Network Activity'.

This is a wrapper script for the 'netstat' command.

You can put this script in the same directory with the Tk script.

The Tk script includes some code (involving the 'argv0' variable) to determine the location of the shell script by extracting the name of the directory in which the Tk script lies.

---

The Tk script is written so that it expects the images for the themes to be put in 'meter_backgrounds', 'pointers', and 'corner_features' subdirectories of the directory where the Tk script and the shell script are placed.

Futhermore, the Tk script is written with an 'imgSUFFIX' variable that is set to 'gif'.

In my testing, I used GIF files for the meter backgrounds, and transparent GIF's for the 'pointer' and 'corner feature' images --- because I was using Tcl-Tk 8.5 which supports GIF's but not PNG's.

I use 'GIFs' and 'PNGs' sub-directories of the 'meter_backgrounds', 'pointers', and 'corner_features' subdirectories.

Anyone using Tcl-Tk 8.6 can use the 'PNGs' image directories by setting the 'imgSUFFIX' variable to 'png' --- and by changing 3 'DIR' variables of the Tk script to use the 'PNGs' subdirectory rather than the 'GIFs' subdirectory.


INSTALLING THE FILES:

The Tk script and the shell script can be put in a subdirectory of the user's home directory --- for example

$HOME/apps/tkNetActivity.

Make 3 subdirectories of that directory --- 'corner_features', 'meter_backgrounds', and 'pointers' --- in which to put the GIF or PNG files for those 3 types of images.

You can right-click in your web browser to download some of the (GIF) images above.

A rather large set of suitable PNG and GIF image files may be available in future releases of the FE 'tkGooies' system.

In the future, I plan to put this hi-def network-activity utility (along with about about 100-plus other mini-utilities --- 'apps') into the 'tkGooies' menu system --- using Tk 'toolchests' to provide the menus.

When I post that 'tkGooies' system release on the www.freedomenv.com software site, that system may contain the GIF and PNG files that were used for the 'themes' shown above --- as well as image files for many more 'themes'.

In the 'tkGooies' system, along with GIF files, I may provide PNG and transparent-PNG files, which are generally of higher quality than the corresponding GIF files --- AND from which it is best to make GIF and transparent-GIF files, scaled to appropriate sizes.

I used the ImageMagick 'convert' command (with an alpha threshold parameter) to make many of the transparent GIF files above from transparent PNG files.


SOME TIPS ON MAKING NICE S-M-L BACKGROUND IMAGES:

In taking a good quality image and scaling it up or down to make the three Small-Medium-Large images, I found that starting with a GIF file was NOT a good idea.

If the file is already using its (typical) limit of about 256 colors, when you scale it up or down, it does not have anymore colors it can turn to in order to make more color shades during the process of averaging the colors of adjacent pixels.

So if you find a nice GIF file that you want to use, convert it to a PNG file first.

I did something like this with the 'mtpaint' image editor.

'mtpaint' has an 'Image > Convert to RGB' toolbar menu option that can be used to convert a loaded GIF file to allow for up to 16 million colors, instead of just 256.

Then I used the 'Image > Scale Canvas...' option to scale the image up or down.

    (I was quite surprised to see that even when scaling the RGB image *UP* a factor of 2 or more that the quality of the image was usually preserved.)

After scaling the image down (or up), I could then save the file, from 'mtpaint', as a GIF.

OR ... I could save as PNG, and then use the ImageMagick 'convert' command to convert the PNG to a GIF.

The conversion-to-GIF usually kept most of the quality that was in the image after the scaling operation.

    (You will get unavoidable 'color banding' when making a GIF from a PNG image with color gradients involving hundreds of color shades.)

With this technique, you can end up with both PNG and GIF files --- and use GIF's with a Tcl-Tk 8.5 'wish' interpreter, and PNG's with a Tcl-Tk 8.6 'wish' interpreter.


MORE HI-DEF METER UTILITIES:

I have returned to the tachometer-style meter that I made for

  • file-system space-used monitoring

and made a 'high-definition' version of that system monitoring app.

That code will be published in these 'tkGooies' code-pages.


ENHANCEMENTS TO CONSIDER

A 'hi-def needle making' technique:

I may try, someday, an image technique to make a high-quality needle that does not suffer from 'the jaggies'.

I do not have a good idea on how to approach that at this time (other than the 2 approaches mentioned above on this page --- rotate-image-on-the-fly OR save about 180 to 360 rotated-images of each needle type).

If I stumble across a promising looking technique, I may try to implement it.

If I ever feel I have the time to experiment with needle-rotating, I may try the rotate-image-code that I mentioned above --- to see if it works fast enough to be used when changing the needle direction on the order of every second or every tenth of a second.

---

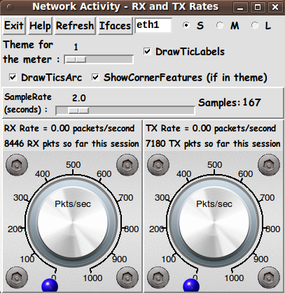
Hiding theme parameter widgets:

We could 'hide' the theme parameter widgets --- that is, the S-M-L radiobuttons, the theme-number scale widget, and several check buttons --- by putting a 'SetTheme' button (or checkbutton) on the GUI.

Clicking on that button could cause a Tk frame to appear, containing those widgets.

Clicking on the button again could cause the frame to disappear.

---

S-M-L pointers and S-M-L corner-features:

For this Tk script, I avoided a proliferation of 'pointer' images and 'corner-feature' images by using the same sized 'pointer' and 'corner-feature' images no matter whether a Small, Medium, or Large background image was being shown.

However, on setting the pointer and corner-feature filenames, we could mimic the code that sets the meter background image.

That code adds '_SMALL' or '_MEDIUM' or '_LARGE' to the array-filename-prefix of the selected background image file.

That is, we could make '_SMALL', '_MEDIUM', and '_LARGE' files in the 'pointers' and 'corner-features' subdirectories --- and change the code that sets those pointer and corner-feature filenames to add '_SMALL' or '_MEDIUM' or '_LARGE' to their array-filename-prefixes --- depending on the current setting of the S-M-L radiobuttons.

If I were making S-M-L versions of the 'corner-features', I would make them about 10% of the size of the S-M-L versions of the meter-background images --- about 20x20 and 35x35 and 50x50 pixels, respectively.

And, if I were making S-M-L versions of the bullet-style 'pointers', I would make them no smaller than 7% of the size of the S-M-L versions of the meter-background images --- no smaller than about 14x14 and 24x24 and 35x35 pixels, respectively.

I did not make S-M-L pointers and corner-features, because I was trying to avoid making 3 times more pointer and corner-feature files.

But, by using 'one-size-only' ('one-size-fits-all') pointer and corner-feature images, for LARGE background images, some of the pointers and corner-features MAY look rather tiny on the large background.

Note that the 'corner feature' images, like the 'meter background' images, are used in the 'make_one_meter' proc --- while the 'pointer' images are used in the 'update_one_pointer' proc.

Those are the 2 procs that would need to have logic changed to handle the new S-M-L images.

---

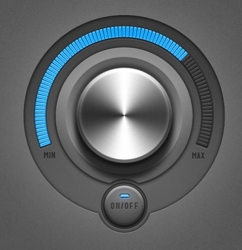
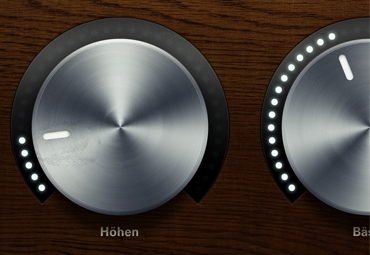
An arc of bullet-pointers:

Instead of using a single 'bullet' image as the 'pointer', one could implement an 'arc of bullets', like in the knob images above.

It would be nice to avoid redrawing all the bullets at each meter update.

This would involve some logic deciding whether to remove or add some bullets, by (essentially) comparing the current 2 packet-rate values to the previous two --- in the 'update_one_pointer' proc.

---

A 'moving skyscraper silhouette' technique:

As I mentioned at the bottom of the 'A Tachometer-style Meter --- for CPU Usage' page, another type of display that I may try on the Tk canvas is a 'moving mountain-range silhouette' --- which one sees in some 'system monitor' apps, such as 'gnome-system-monitor' (on Linux) -- under the 'Resources' tab.

That 'Resources' panel has 'traveling histories' titled 'CPU history', 'Memory-and-Swap history', and 'Network history'.

This kind of display has the advantage of preserving the recent history of the trasmission and reception rates of packets --- about 6 minutes of history across a 180-pixel-wide canvas, if we are sampling about once every 2 seconds.

This type of animated plot could be created with Tk by using a 'create line' technique on the Tk canvas, to plot vertical lines (to create a 'silhouette-type' plot) --- or simply single pixels (to create a 'thin-line-type' plot).

Alternatively, one could use 'create image' and move images horizontally across the canvas one pixel at a time --- adding a vertical line of pixels on one side of the canvas each of those times.

This 'history display' technique may be especially suitable for an alternative version of 3 of the 4 apps that I have implemented:

  • the 'memory-and-swap',
  • the 'network activity', and
  • the 'CPU activity'

apps.

Those are the 3 types of activity shown in the 'Resources' panel of the 'gnome-system-monitor' utility.

    (The traveling-curve type of usage display is typically not used for 'file-system-usage', because that usage ordinarily does not change much --- unless you are storing huge files all of a sudden.)


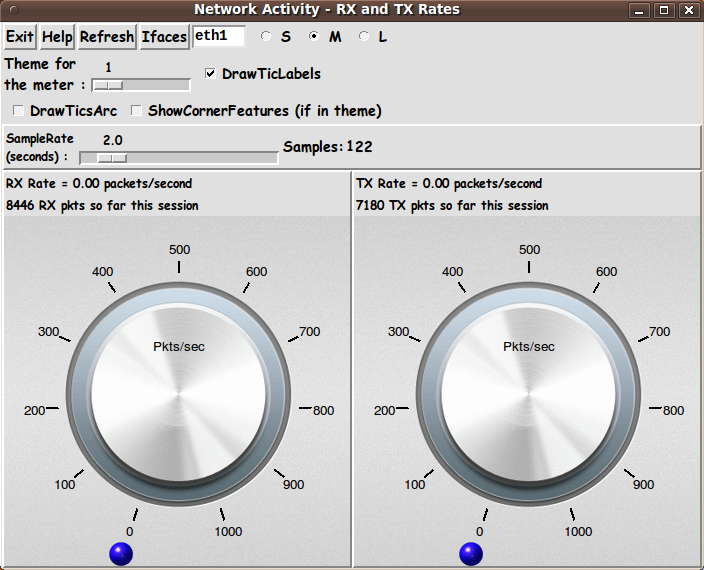
Responsiveness of the GUI to theme changes

I should point out that I was pleased by how fast the Tk GUI responded when I changed themes via the 'theme-scale' widget.

I put a 'bind' command on the 'theme-scale' widget so that --- when the user releases MB1 (mouse button 1) after moving the slider button to a new integer value --- the 'Refresh' proc is run to re-build the meter background and start updating the 'pointer' again, according to the current setting of the 'SampleRate' 'scale' widget.

Within a fraction of a second after releasing MB1 (after making a change to the theme integer in the scale widget), the entire meter is redrawn --- including

  • meter background image
  • tic marks
  • tic mark arc
  • tic labels
  • the 4 corner features,
  • various text labels, and
  • the 'pointer'.

Similarly, a 'bind' command was put on the SML radiobuttons --- and within a fraction of a second after releasing MB1 on one of the radiobuttons, the meter is redrawn using the new size of background image.

(Thank you, wonderful 'wish' interpreter --- and Gnu/Linux scripting.)

---

Oh, the possibilities we have with Tk.

The possibilities are endless ... I say to the 'Tcl is dead' nay-sayers ... those 'nattering nabobs of negativism'.

    For the youngsters reading this, the phrase 'nattering nabobs of negativism' was used by Spiro Agnew in 1970, during the Richard Nixon era.


IN CONCLUSION

As I have said on other code-donation pages on this FE web site ...

There's a lot to like about a utility that is 'free freedom' --- that is, no-cost and open-source so that you can modify/enhance/fix it without having to wait for someone else to do it for you (which may be never).

A BIG THANK YOU to Ousterhout for starting Tcl-Tk, and a BIG THANK YOU to the Tcl-Tk developers and maintainers who have kept the simply MAH-velous 'wish' interpreter going.

Bottom of this web page for
presenting Tcl-Tk and shell script code for
Meters for Network Activity
(using a HiDef Background Image)

--- a utility in the FE 'tkGooies' system,
in the 'SYSTEMtools' group.

To return to a previously visited web page location, click on the Back button of your web browser a sufficient number of times. OR, use the History-list option of your web browser.
OR ...

< Go to Top of Page, above. >

Page history:

This FE web page was created 2015 Nov 09.

Page was changed 2015 Nov 11.
(Added links to Medium and Large meter background images.)

Page was changed 2019 Mar 07.
(Added css and javascript to try to handle text-size for smartphones, esp. in portrait orientation.)

Page was changed 2019 Jul 07.
(Specified image widths in percents to size the images according to width of the browser window. Also added some web links.)


NOTE:
This code and description has NOT been posted on a Tcler's Wiki page --- at wiki.tcl-lang.org --- formerly wiki.tcl.tk.

If I ever do so, as a backup and alternative to this page, I plan to add a link to that Wiki page here.