FE 'tkGooie' Utilities
'ODEtools' group
|
![]() FE 'tkGooie' interface to simulate population growth (human, bacterial, etc.) via numerical solution of a differential equation --- and produce an XY plot on a 'canvas' on the GUI. Large, hi-res image is below. |
FE Home Page >
FE Downloads Page >
FE 'tkGooies' Description and Menu Page >
FE 'tkGooies' 'MATHtools' Menu Page >
FE 'tkGooies' 'ODEtools' Menu Page >
This
'tkSimulatePopulationGrowthLimit'
tkGooie Page
INTRODUCTION to Tcl-Tk script For at least 5 years now (about 2011 to 2016), I have had it on my Tk-scripts-to-do list to implement Tcl-Tk GUI scripts that perform numerical integration of the ODE's ( ordinary differential equations ) that describe some dynamic physics configurations of classical mechanics --- as well as handling some non-physics applications. I had in mind the differential equations describing
Recently (July 2016), I finally implemented the first two items on this list:
Those two Tk GUI scripts provided an opportunity for animating a representation of a pendulum arm-and-bob and a bouncing-ball --- on a Tk 'canvas' widget. I want to continue making Tk ODE scripts involving gravity --- some more situations from classical mechanics --- such as simulation of projectile flight and simulation of a spring-mass-damper system. But before tackling more 'physics-ODE-tools', I decided to try implementing one of the ODEs-to-do in the category of 'social sciences'. I decided to start with the 'populations subject to limits on growth' item on the to-do list above. --- References : In my readings over the years, I have stumbled across many books and on-line documents that discussed the human-population-growth issues that were raised by Thomas Malthus in a book called 'An Essay on the Principle of Population as It Affects the Future Improvement of Society', published in 1798 --- about 71 years after the death of Isaac Newton. These issues were given a more precise mathematical flavor by the 'logistic differential equation', a differential equation for population dynamics proposed by Pierre François Verhulst --- around 1838 --- about 40 years after Malthus's book. For example, I refer you to the book 'Great Calculations' (2015) by Colin Pask. The first 'Great Calculation' that Pask presents is found on pages 18-21, in section 1.2, titled 'Malthus gives us calculation 1'. In that same book, see pages 343-350 in section 12.5 'Discovering Chaos' --- in particular, see section 12.5.1 'Revisiting Malthus'. --- A limited-growth equation : A relatively simple form of the ODE for limited population growth is called 'the logistic equation': |
D(u) = (r * (1 - u/k)) * u
where D represents the time-derivative operator d/dt,
and t represents the time independent variable,
and u represents the population (typically, taken to
be the population of all mankind on Earth),
and r is 'the intrinsic growth rate' (which is
the net growth rate --- the overall birth rate
minus the overall death rate --- when the population
is nowhere near being limited by resources),
and k is 'the saturation level' of the population.
In the case of humans on Earth, this could
be given a reasonable value by taking the
amount of habitable surface area of the Earth
and multiplying by a limiting population density
on the Earth, which may be on the order of
100 people per square kilometer, on average.
There would probably be many square miles of land
that would be needed to grow food --- unless
mankind eventually got essentially all food from
the seas (or dirt).
In any case, there would probably need to be
some room allowed to avoid spread of diseases
and relieve war-like tensions, like demilitarized
zones ---
and room for some areas for sewage and garbage
disposal/storage/recycling and for storage and
processing of non-salty, disease-free water
--- and, perhaps, some room for energy-generating
facilities --- and room for transporation avenues and
parking facilities for various kinds of vehicles.
(A separate Tk GUI utility could be provided to
calculate a value for 'k', taking into account
factors like those above
--- including the radius of the planet and
percent of the planet covered by oceans,
deserts, mountains, volcano areas,
flood-prone areas, etc.
I would include ice in that list,
but in another 40 years or so,
there won't be much ice left on Earth.)
Note that the factor (r * (1 - u/k)) is the effective growth rate. In this form, the rate goes to zero as the population, u, approaches the 'saturation level', k. And the growth rate is about 'r' at very low population levels that are not triggering the limits to growth. Note that the factor (1 - u/k) may under-estimate --- or over-estimate --- the rate at which the growth rate goes to zero as the population u increases. That is, the ratio u/k may approach 1 too slowly or too quickly --- as u increases. Hence (1 - u/k) may not provide a good prediction of the population in a given situation --- human population, bacterial population, or other. It may be that the factor (1 - u/k) should take some other form such as (1 - (u/k)^2) OR (1 - sqrt(u/k)) to more accurately model the change in population growth rate as population increases. There are many other critiques that could be leveled at the 'logistic' ODE --- such as, the 'growth rate at low population levels' --- 'r' --- is not really a constant. The 'r' factor would depend on many growth-rate influencers, such as changes in medical procedures. So 'r' probably should not be formulated as a constant. And specifying the population limit 'k' is like putting the 'cart before the horse' --- or 'weighting the dice' to pre-determine the outcome. The limit 'k' would depend on many factors, such as changes in what is acceptable for living conditions. And 'k' should probably have a more complex form --- and be made up of many other constants --- such as the size of the growth area and the amount of certain resources available. But, for now, we stick with the classic 'logistic' equation. It gives us a rough idea of how a population could be expected to increase ---- for given 'r' and 'k', constants. These considerations demonstrate why the Tk script that I wanted to write would use numerical integration to solve a differential equation --- rather than trying for an algebraic 'closed-form' solution to any differential equation for population growth that might come under consideration. A numerical solution method (applied to a differential equation) will allow for solving a wide variety of forms of the growth rate equation. GOALS for the GUI For now, I decided to go with the 'logistic' differential equation above. In that case, the GUI should allow the user to enter various values for 'r' and 'k'. The GUI also should allow the user to enter parameters for the solver process:
After the data from a solution run is available, the GUI script could activate a 'Plot' button that allows the user to plot a graph of the population curve --- drawn on a Tk 'canvas' widget. The plot is to be drawn on a rectangular Tk 'canvas' widget by using 'create line' and 'create text' commands on the Tk canvas. --- To evaluate any further requirements that we may need for the GUI, it is helpful to know some of the details of
Some details follow. METHOD of MATH MODELING OF THE 'LOGISTIC' EQUATION : We write the first-order non-linear population equation as D(u) = r * (1 - u/k) * u with initial condition u(0)=A, where A is an initial population value (of humans, bacteria, viruses, parasites, ants, roaches, termites, algae, scum, whatever). The common way of expressing systems of 'first order' differential equations in compact, general form is D(u) = f(t,u) where u and f are N-dimensional vectors. This is a compact way of expressing a system of scalar differential equations:
D(u1) = f1(t,u1,...,uN)
by letting u be vector (u1, u2, ... , uN)
--- In the case of the 'logistic equation', N is equal to 1. We can think of solving for the unknown 1-D function vector (u1(t)) where the right-hand-side (RHS) of the 'logistic' equation above can be thought of as a special case of a more general user-specified 1-D function vector (f1(t,u1)) where
f1(t,u1) =
which is a 2nd-degree polynomial with respect to variable u1. We use the popular Runge-Kutta 4th order method (RK4) to perform the numerical integration for a user-specified time step, h. We basically use two procs to perform the integration steps:
The latter proc ('deriv', say) is called several times by the former proc ('rk4', say), for each time step.
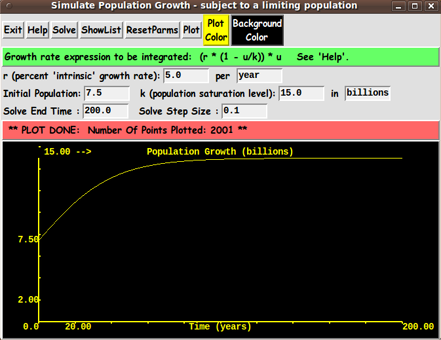
METHOD of PLOTTING After a solution, we have the solution function u1 for a sequence of equally-spaced time values. We use time, t, as the horizontal axis of the plot. The time goes from zero to the end-time, tmax, specified by the user. As the numerical integration proceeds, we keep track of the maximum value, umax, reached by u1 over the integration time period. The solution curve is plotted in a rectangular area:
A margin is to be supplied around this rectangular area, and two axes are drawn --- a horizontal time-axis and a vertical u-axis (population). Min and max values are to be indicated on the ends of the 2 axes. Intermediate tic-marks and tic-labels may also be supplied. It would be nice for the GUI to provide 2 buttons by which the user can specify 2 colors for:
A 'plot' proc (with auxiliary procs) performs the plot of the solution when the user clicks on a 'Plot' button of the GUI. This 'plot' proc uses the 'world-coordinates' --- the 0 to tmax values and the 0 to umax values --- to draw the plot within an area of about tmax by umax in world coordinates. Actually, we augment this world-coordinates rectangular area by providing a margin of about 0.1*tmax and 0.1*umax on the left and right and on the top and bottom, respectively, of the plot area. A proc is provided which maps the plot area limits in world coordinates --- say
UpperLeftCorner: ( -0.1*tmax , 1.1*umax )
to the corners of the plot area in pixel coordinates:
UpperLeftCorner: (0,0)
We may allow the user to determine the ImageWidthPx and ImageHeightPx values (in pixels) by letting the user resize the window, which will cause the Tk 'canvas' widget to resize --- and we will query the current canvas size to get ImageWidthPx and ImageHeightPx. Hence we avoid having to use widgets on the GUI by which the user can specify the size of the plot area. The 'plot' proc uses 2 procs --- Xwc2px and Ywc2px --- to convert the world coordinates of each point --- such as the end-points of the axes and the end-points of line-segments connecting successive plot points --- to pixel coordinates. The pixel-coordinates are used in 'create line' and 'create text' commands to draw the plot on the canvas.
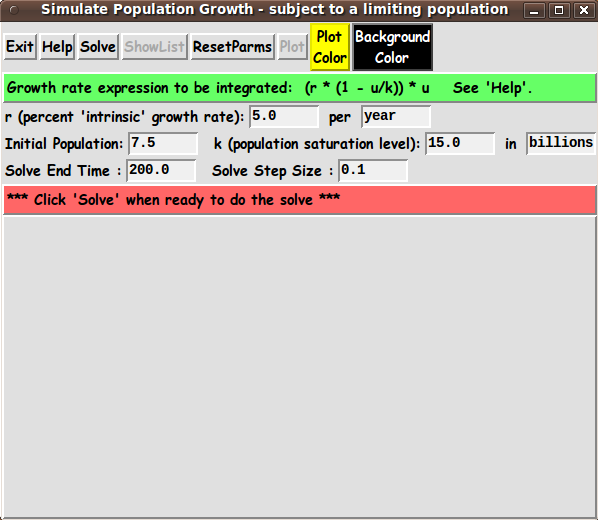
 THE GUI LAYOUT : Based on the notes above, the Tk GUI should allow the user to specify
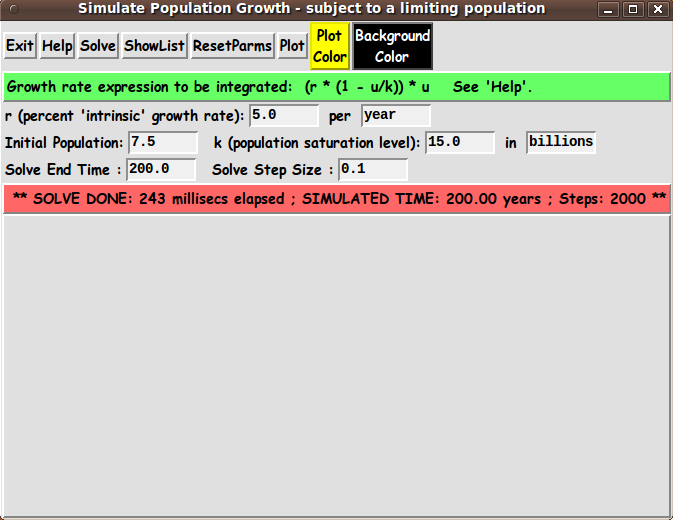
There is to be a 'Solve' button to perform a solution when the user is ready to use these parameters. A 'ShowList' button can be used to show the list of solution values --- t(i), u1(t(i)) --- in a popup window. There are also to be 2 buttons by which to call up an RGB-color-selector GUI by which to specify the 2 colors for the animation drawing on the canvas. In addition, on the GUI, there is to be a 'Plot' button to generate the population plot. One way the user can specify all these parameters is indicated by the following 'sketch' of a layout for the GUI. In the following sketch of the GUI: |
SQUARE BRACKETS indicate a comment (not to be placed on the GUI).
BRACES indicate a Tk 'button' widget.
UNDERSCORES indicate a Tk 'entry' widget.
A COLON indicates that the text before the colon is on a 'label' widget.
CAPITAL-O indicates a Tk 'radiobutton' widget.
CAPITAL-X indicates a Tk 'checkbutton' widget (if any).
Vertical bars (and horizontal hyphens) outline a 'canvas' widget.
If there are scrollbars:
Less-than and greater-than signs indicate the left and right ends of a horizontal 'scrollbar'.
Capital-V and Capital-A letters indicate the bottom and top ends of a vertical 'scrollbar'.
Here is the sketch :
FRAMEnames
VVVVVVVVVV
------------------------------------------------------------------------------------------
Simulate Population Growth - subject to a limiting population
[window title]
------------------------------------------------------------------------------------------
.fRbuttons {Exit} {Help} {Solve} {Show {Reset {Plot} {Plot {Background
List} Parms} Color} Color}
.fRrhs [ ........ Population growth expression goes here, in a label widget .......... ]
(This could be an entry widget, someday, to allow for changes in the math expression.)
.fRparms r (percent 'intrinsic' growth rate): 0.1__ per year___
.fRinit Initial Population: 7.0____ k (population saturation level: 20.0__ in billions___
.fRtimes Solve End Time: 100__ Solve Step Size: 0.1___
.fRmsg [ .......... Messages go here, in a label widget .......................... ]
.fRcanvas |------------------------------------------------------------------------|
| |
| [This area contains a non-scrollable Tk 'canvas' widget |
| on which the plot is drawn. |
| |
| The canvas widget is centered at the top of this area.] |
| |
| |
| |
| |
|------------------------------------------------------------------------|
GUI components: From the GUI 'sketch' above, it is seen that this GUI layout consists of about
The GUI (a screenshot) To implement this Tk GUI script, I fetched one of my scripts that had most of these GUI elements and converted it to a 'tkSimulatePopulationGrowthLimit' script. I ended up with the GUI seen in the following image. |
This is the GUI as it first appears. As the message in the middle of the GUI indicates, the user can take the defaults for all the parameters and simply click on the 'Solve' button to do the numerical integration. Just as I found with the 'tkSimulateSinglePendulum' script and the 'tkSimulateBouncingBall' script, the first time I ran the solve-process (after fixing a bunch of syntax errors in the code), I found that the solve completes quickly --- in less than a second! For example, the following screenshot shows that the 'SOLVE DONE' message said that the elapsed time for the solve was 243 milliseconds --- less than one-quarter of a second for 2,000 time-steps of integration. Not bad, considering I have not expended time trying to obtain the optimum speed out of all the numerical integration code. |
When I clicked on the 'ShowList' button, a list of the computed results --- time and population level --- appeared for the 2,000 time steps --- and showed the parameters of the simulation as well as the results. --- Note that you can use the 'ShowList' button to generate columns of decimal numbers that can be copied-and-pasted into a text-editor window. The text editor can be used to save the data to a text file. Then that text file can be edited (to remove or comment out the header and trailer text) and fed into a 'tkGooie' plot utility such as to get a plot of the population versus time. --- To give you an idea of what a plot looks like, here is a 'screenshot'. |
Before clicking the 'Plot' button to perform this plot, I could have used one of the 2 color buttons to call up a color selector GUI to set the color of the plot elements (line-segments and text) to white. OR, I could have used a white background and black plot elements --- like a black-and-white ink plot done on a sheet of white paper. The reduced-size screenshot at the top of this page shows the image area in the default colors --- yellow for the plot lines-and-text and black for the background. --- HELP TEXT The 'Help' button on the GUI shows extensive text describing this utility, in a popup window with scrollbars for the text area. DESCRIPTION OF THE CODE Below I provide a link to the Tk script code for this 'tkSimulatePopulationGrowthLimit' utility. For this Tk script, I follow my usual 'canonical' structure for Tk code: |
0) Set general window & widget parms (win-name, win-position,
win-color-scheme, fonts, widget-geometry-parms, win-size-control,
text-array-for-labels-etc).
1a) Define ALL frames (and sub-frames, if any).
1b) Pack ALL frames and sub-frames.
2) Define & pack all widgets in the frames, frame by frame.
Within each frame, define ALL the widgets. Then pack the widgets.
3) Define keyboard and mouse/touchpad/touch-sensitive-screen action
BINDINGS, if needed.
4) Define PROCS, if needed.
5) Additional GUI initialization (typically with one or more of
the procs), if needed.
This Tk coding structure is discussed in more detail on the page A Canonical Structure for Tk Code --- and variations. This structure makes it easy for me to find code sections --- while generating and testing a Tk script --- and when looking for code snippets to include in other scripts (code re-use). I call your attention to step-zero. One thing that I started doing in 2013 is using a text-array variable --- named 'aRtext' --- for text in labels, buttons, and other widgets in the GUI. This can make it easier for people to internationalize my scripts. I will be using a text-array like this in most of my scripts in the future. Experimenting with the GUI As in all my scripts that use the 'pack' geometry manager (which is all of my 100-plus scripts, so far), I provide the four main 'pack' parameters
on all of the 'pack' commands for the frames and widgets. That helps me when I am initially testing the behavior of a GUI (the various widgets within it) as I resize the main window. I think that I have used a nice choice of the 'pack' parameters. In particular ... The label and button and entry widgets stay fixed in size and relative-location as the window is re-sized --- while the area containing the 'canvas' can expand/contract as the window is re-sized. You can experiment with the '-side', '-anchor', '-fill', and '-expand' parameters on the 'pack' commands for the various frames and widgets --- to get the widget behavior that you want. --- Additional experimentation with the GUI: You might want to change the fonts used for the various GUI widgets. For example, you could change '-weight' from 'bold' to 'normal' --- or '-slant' from 'roman' to 'italic'. Or change font families. In fact, you may NEED to change the font families, because the families that I used may not be available on your computer --- and the default font that the 'wish' interpreter chooses may not be very pleasing. I use variables to set geometry parameters of widgets --- parameters such as border-widths and padding. And I have included the '-relief' parameter on the definitions of frames and widgets. Feel free to experiment with those 'appearance' parameters as well. --- Note that the color buttons call on a color-selector-GUI script to set the colors. You can make that color-selector script by copying-and-pasting the code from the page offering 'a non-obfuscated color selector GUI', on this site. Some comments and code at the bottom of this 'population growth' Tk script explain how you can implement the RGB color selector script. Some features in the code There are plenty of comments in the code, to describe what most of the code-sections are doing. You can look at the top of the PROCS section of the code to see a list of the procs used in this script, along with brief descriptions of how they are called and what they do. --- Below is a brief overview of the procs of the script. |
- 'solve' - called by the 'Solve' button.
- 'runge-kutta-4' - called by the 'solve' proc.
- 'deriv' - called by the 'runge-kutta-4' proc.
- 'show_list' - called by the 'ShowList' button
- 'plot' - called by the 'Plot' button.
- 'setMappingVars_for_px2wc' - called by proc 'plot'.
- 'Xpx2wc' - called by proc 'plot'.
- 'Ypx2wc' - called by proc 'plot'.
- 'set_tic_interval' - called by proc 'plot'.
- 'set_tics_list' - called by proc 'plot'.
- 'set_plot_color1' - called by the 'PlotColor' button.
- 'set_background_color2' - called by the 'BackgroundColor' button.
- 'update_color_button' - sets background & foreground color of
either of the 2 color buttons.
- 'advise_user' - called by the 'solve' proc and bindings.
- 'reset_parms' - called by the 'ResetParms' button and in the
'Additional GUI Initialization' section,
to initialize the parms.
- 'edit_inputs' - called by proc 'solve'
- 'decimal_check' - called by proc 'edit_inputs'
- 'popup_msgVarWithScroll' - called by the 'Help' button.
The main numerical integration code is in the 'runge-kutta-4' and 'deriv' procs. See the comments in those procs for details on their implementation. The math expression for the 'logistic equation' is in the 'deriv' proc. --- The code for putting the tic marks on the axes is in the 'set_tic_interval' and 'set_tics_list' procs. I may use these procs in some Tk 'PlotQuik' utilities that I have been meaning to put in the 'tkGooies' system for more than a year now. A fervent hope It is my hope that the copious comments in the code will help Tcl-Tk coding 'newbies' get started in making GUI's like this. Without the comments, potential young Tcler's might be tempted to return to their iPhones and iPads and iPods --- to find videos of Hillary Clinton babbling on about 'short circuiting' (around 2016) --- in a way that looks like she has indeed blown a fuse --- which is causing her to babble on incoherently in an attempt to explain why she said the FBI director said something that he did not say. OR, potential young Tcler's might be tempted to spend time finding the video of Warren Buffet speaking to Donald Trump --- pointing out that Warren too was having his tax returns audited --- but, unlike 'the Donald', 'the Warren' was willing to go over his tax return line-by-line in public --- if Donald would join him and go over Donald's tax returns line-by-line, with Warren. Man, I would like to see that video --- Warren and Donald exposing themselves, line-by-line. But --- before spending time finding videos like those, Tclers, please install-use-change-enhance the following script. The Tcl-Tk CODE : Here is a link to CODE for the script 'tkSimulatePopulationGrowthLimit.tk'. With your web browser, you can 'right-click' on this link --- and in the menu that pops up, select an item like 'Save Link Target As ...' to save this file to your local computer. Then you can rename the file to remove the '.txt' suffix. Make sure that you have execute permission set on the file --- in order to execute the script. SOME POTENTIAL ENHANCEMENTS: Some features that I may add to this Tk script --- or implement in a separate Tk script:
--- There will probably more enhancements that I may think of in the future, although some might be more suitable for putting in a different Tk script where there is a stronger argument for adding such enhancements. ---
For those who might want to go ahead To help out in making scripts like this, here is a page that provides sources of Tcl-Tk code snippets by providing links to various 'tkGooies' scripts that can make it relatively quick work to compose
And when you get to the testing-and-debugging phase in development of a script, here is a page that describes the wonderfulness of the 'wish' 'stack trace' facility, which can make the testing-and-debugging go relatively quickly and painlessly. IN CONCLUSION There's a lot to like about a utility that is 'free freedom' --- that is, no-cost and open-source so that you can modify/enhance/fix it without having to wait for someone else to do it for you (which may be never). I hope to provide more free scripts that can be used to demonstrate mathematical and physics principles (and Tk coding techniques) --- scripts that could be used in a classroom or self-teaching setting --- or for R-and-D (research and development) --- and maybe be adapted for use by companies or government agencies (for beneficial purposes). As I have said on other 'tkGooie' pages of this FE web site ... A BIG THANK YOU to Ousterhout for starting Tcl-Tk, and a BIG THANK YOU to the Tcl-Tk developers and maintainers who have kept the simply MAH-velous 'wish' interpreter going. |
Bottom of the page for
To return to a previously visited web page location, click on the
Back button of your web browser a sufficient number of times.
OR, use the History-list option of your web browser.
< Go to Top of Page, above. >Page history:
This FE web page was created 2016 Aug 09.
NOTE: |